Mean State
Download Data |
Period Mean (original grids) [Pg] |
Model Period Mean (intersection) [Pg] |
Model Period Mean (complement) [Pg] |
Benchmark Period Mean (intersection) [Pg] |
Benchmark Period Mean (complement) [Pg] |
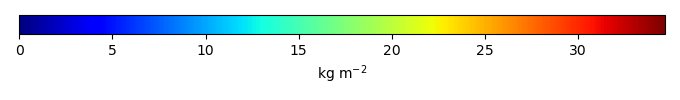
Bias [kg m-2] |
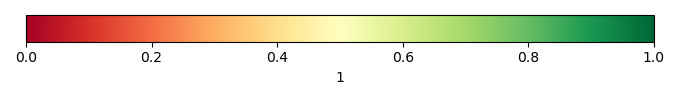
Bias Score [1] |
Spatial Distribution Score [1] |
Overall Score [1] |
|||
|---|---|---|---|---|---|---|---|---|---|---|---|---|
| Benchmark | [-] | 364. | ||||||||||
| bcc-csm1-1 | [-] | 476. | 442. | 25.8 | 364. | 0.286 | 1.17 | 0.645 | 0.817 | 0.731 | ||
| bcc-csm1-1-m | [-] | 385. | 369. | 14.8 | 362. | 1.90 | 0.207 | 0.635 | 0.797 | 0.716 | ||
| BNU-ESM | [-] | 917. | 873. | 27.2 | 364. | 0.479 | 5.14 | 0.414 | 0.395 | 0.404 | ||
| CanESM2 | [-] | 529. | 496. | 19.8 | 364. | 1.05 | 0.516 | 0.757 | 0.637 | |||
| CESM1-BGC | [-] | 529. | 521. | 6.97 | 362. | 2.20 | 1.79 | 0.472 | 0.552 | 0.512 | ||
| GFDL-ESM2G | [-] | 655. | 621. | 25.5 | 364. | 2.87 | 0.557 | 0.781 | 0.669 | |||
| HadGEM2-CC | [-] | 439. | 425. | 11.5 | 362. | 2.44 | 1.06 | 0.588 | 0.820 | 0.704 | ||
| HadGEM2-ES | [-] | 453. | 439. | 11.6 | 362. | 2.44 | 1.18 | 0.592 | 0.824 | 0.708 | ||
| inmcm4 | [-] | 603. | 582. | 23.0 | 347. | 17.7 | 2.06 | 0.593 | 0.849 | 0.721 | ||
| IPSL-CM5A-LR | [-] | 622. | 590. | 21.6 | 363. | 1.23 | 2.66 | 0.507 | 0.665 | 0.586 | ||
| IPSL-CM5A-MR | [-] | 633. | 608. | 19.1 | 363. | 1.82 | 2.69 | 0.499 | 0.659 | 0.579 | ||
| MeanCMIP5 | [-] | 455. | 442. | 12.5 | 364. | 1.58 | 0.626 | 0.894 | 0.760 | |||
| MIROC-ESM | [-] | 349. | 334. | 12.8 | 331. | 32.8 | 0.0179 | 0.578 | 0.745 | 0.662 | ||
| MIROC-ESM-CHEM | [-] | 351. | 334. | 12.8 | 331. | 32.8 | 0.0197 | 0.583 | 0.762 | 0.672 | ||
| MPI-ESM-LR | [-] | 335. | 325. | 8.08 | 337. | 27.2 | -0.105 | 0.582 | 0.809 | 0.695 | ||
| MRI-ESM1 | [-] | 588. | 579. | 8.20 | 364. | 2.28 | 0.517 | 0.629 | 0.573 | |||
| NorESM1-M | [-] | 537. | 516. | 14.2 | 364. | 1.90 | 0.465 | 0.527 | 0.496 | |||
| NorESM1-ME | [-] | 548. | 526. | 14.7 | 364. | 2.01 | 0.462 | 0.510 | 0.486 |
Download Data |
Period Mean (original grids) [Pg] |
Model Period Mean (intersection) [Pg] |
Model Period Mean (complement) [Pg] |
Benchmark Period Mean (intersection) [Pg] |
Benchmark Period Mean (complement) [Pg] |
Bias [kg m-2] |
Bias Score [1] |
Spatial Distribution Score [1] |
Overall Score [1] |
|||
|---|---|---|---|---|---|---|---|---|---|---|---|---|
| Benchmark | [-] | 88.9 | ||||||||||
| bcc-csm1-1 | [-] | 71.8 | 68.1 | 0.329 | 88.9 | 0.0278 | -2.08 | 0.672 | 0.760 | 0.716 | ||
| bcc-csm1-1-m | [-] | 55.7 | 55.5 | 0.129 | 88.8 | 0.135 | -3.79 | 0.625 | 0.701 | 0.663 | ||
| BNU-ESM | [-] | 151. | 143. | 0.540 | 88.8 | 0.0432 | 6.94 | 0.578 | 0.712 | 0.645 | ||
| CanESM2 | [-] | 41.9 | 37.5 | 0.230 | 88.9 | -6.00 | 0.501 | 0.749 | 0.625 | |||
| CESM1-BGC | [-] | 151. | 150. | 0.191 | 88.8 | 0.0655 | 7.49 | 0.453 | 0.581 | 0.517 | ||
| GFDL-ESM2G | [-] | 73.9 | 75.0 | 0.447 | 88.9 | -1.26 | 0.673 | 0.843 | 0.758 | |||
| HadGEM2-CC | [-] | 122. | 121. | 0.335 | 88.9 | 0.0279 | 4.18 | 0.661 | 0.935 | 0.798 | ||
| HadGEM2-ES | [-] | 122. | 122. | 0.330 | 88.9 | 0.0279 | 4.27 | 0.667 | 0.927 | 0.797 | ||
| inmcm4 | [-] | 88.1 | 87.8 | 0.640 | 88.1 | 0.767 | -0.0417 | 0.758 | 0.712 | 0.735 | ||
| IPSL-CM5A-LR | [-] | 89.1 | 87.6 | 0.515 | 88.9 | 0.0223 | 0.341 | 0.638 | 0.879 | 0.758 | ||
| IPSL-CM5A-MR | [-] | 82.0 | 80.8 | 0.454 | 88.8 | 0.0545 | -0.487 | 0.613 | 0.847 | 0.730 | ||
| MeanCMIP5 | [-] | 84.3 | 84.0 | 0.315 | 88.9 | 0.975 | 0.720 | 0.894 | 0.807 | |||
| MIROC-ESM | [-] | 50.6 | 48.4 | 0.296 | 88.1 | 0.742 | -4.78 | 0.603 | 0.703 | 0.653 | ||
| MIROC-ESM-CHEM | [-] | 57.3 | 54.8 | 0.430 | 88.1 | 0.742 | -4.00 | 0.620 | 0.833 | 0.726 | ||
| MPI-ESM-LR | [-] | 56.4 | 55.1 | 0.129 | 87.4 | 1.52 | -3.99 | 0.593 | 0.858 | 0.726 | ||
| MRI-ESM1 | [-] | 140. | 140. | 0.433 | 88.9 | 6.24 | 0.643 | 0.946 | 0.795 | |||
| NorESM1-M | [-] | 139. | 138. | 0.687 | 88.9 | 6.11 | 0.474 | 0.572 | 0.523 | |||
| NorESM1-ME | [-] | 141. | 140. | 0.709 | 88.9 | 6.36 | 0.476 | 0.567 | 0.521 |
Temporally integrated period mean