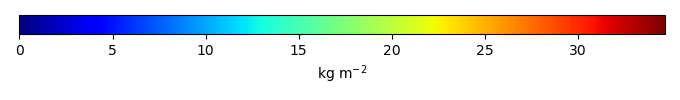
Mean State
Download Data |
Period Mean (original grids) [Pg] |
Model Period Mean (intersection) [Pg] |
Model Period Mean (complement) [Pg] |
Benchmark Period Mean (intersection) [Pg] |
Benchmark Period Mean (complement) [Pg] |
Bias [kg m-2] |
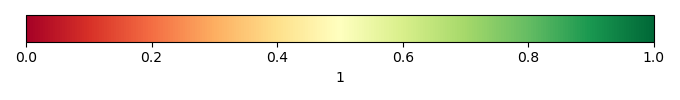
Bias Score [1] |
Spatial Distribution Score [1] |
Overall Score [1] |
|||
|---|---|---|---|---|---|---|---|---|---|---|---|---|
| Benchmark | [-] | 349. | ||||||||||
| bcc-csm1-1 | [-] | 475. | 324. | 144. | 349. | 0.356 | 0.349 | 0.654 | 0.831 | 0.742 | ||
| bcc-csm1-1-m | [-] | 384. | 268. | 116. | 347. | 1.74 | -0.938 | 0.620 | 0.804 | 0.712 | ||
| BNU-ESM | [-] | 917. | 708. | 191. | 348. | 0.529 | 6.45 | 0.457 | 0.515 | 0.486 | ||
| CanESM2 | [-] | 529. | 326. | 190. | 349. | -0.340 | 0.552 | 0.818 | 0.685 | |||
| CESM1-BGC | [-] | 530. | 445. | 82.5 | 347. | 2.11 | 2.11 | 0.501 | 0.556 | 0.528 | ||
| GFDL-ESM2G | [-] | 655. | 403. | 243. | 349. | 1.76 | 0.611 | 0.853 | 0.732 | |||
| HadGEM2-CC | [-] | 439. | 344. | 93.3 | 347. | 1.94 | 0.643 | 0.629 | 0.881 | 0.755 | ||
| HadGEM2-ES | [-] | 453. | 349. | 102. | 347. | 1.94 | 0.726 | 0.633 | 0.883 | 0.758 | ||
| inmcm4 | [-] | 603. | 378. | 227. | 330. | 18.6 | 0.716 | 0.654 | 0.895 | 0.774 | ||
| IPSL-CM5A-LR | [-] | 622. | 299. | 312. | 347. | 1.45 | 0.341 | 0.598 | 0.772 | 0.685 | ||
| IPSL-CM5A-MR | [-] | 632. | 291. | 335. | 347. | 2.26 | 0.0525 | 0.599 | 0.788 | 0.694 | ||
| MeanCMIP5 | [-] | 454. | 314. | 141. | 349. | 0.724 | 0.681 | 0.930 | 0.805 | |||
| MIROC-ESM | [-] | 350. | 210. | 137. | 318. | 30.5 | -1.72 | 0.581 | 0.694 | 0.637 | ||
| MIROC-ESM-CHEM | [-] | 351. | 216. | 130. | 318. | 30.5 | -1.62 | 0.584 | 0.734 | 0.659 | ||
| MPI-ESM-LR | [-] | 335. | 250. | 83.1 | 319. | 30.2 | -1.08 | 0.597 | 0.860 | 0.729 | ||
| MRI-ESM1 | [-] | 587. | 413. | 173. | 349. | 1.49 | 0.559 | 0.717 | 0.638 | |||
| NorESM1-M | [-] | 537. | 431. | 98.6 | 349. | 2.13 | 0.481 | 0.525 | 0.503 | |||
| NorESM1-ME | [-] | 548. | 440. | 99.8 | 349. | 2.30 | 0.477 | 0.508 | 0.493 |
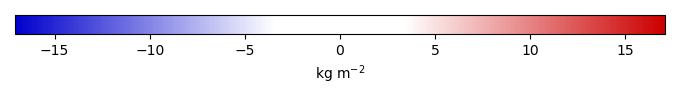
Download Data |
Period Mean (original grids) [Pg] |
Model Period Mean (intersection) [Pg] |
Model Period Mean (complement) [Pg] |
Benchmark Period Mean (intersection) [Pg] |
Benchmark Period Mean (complement) [Pg] |
Bias [kg m-2] |
Bias Score [1] |
Spatial Distribution Score [1] |
Overall Score [1] |
|||
|---|---|---|---|---|---|---|---|---|---|---|---|---|
| Benchmark | [-] | 100. | ||||||||||
| bcc-csm1-1 | [-] | 71.7 | 68.0 | 0.415 | 100. | 0.0375 | -3.43 | 0.675 | 0.830 | 0.752 | ||
| bcc-csm1-1-m | [-] | 55.6 | 55.4 | 0.124 | 100. | 0.132 | -5.14 | 0.618 | 0.774 | 0.696 | ||
| BNU-ESM | [-] | 151. | 143. | 0.651 | 100. | 0.0632 | 5.62 | 0.634 | 0.675 | 0.654 | ||
| CanESM2 | [-] | 41.7 | 37.3 | 0.310 | 100. | -7.35 | 0.519 | 0.796 | 0.658 | |||
| CESM1-BGC | [-] | 151. | 150. | 0.210 | 100. | 0.0690 | 6.15 | 0.504 | 0.526 | 0.515 | ||
| GFDL-ESM2G | [-] | 73.9 | 74.9 | 0.482 | 100. | -2.60 | 0.694 | 0.898 | 0.796 | |||
| HadGEM2-CC | [-] | 122. | 121. | 0.358 | 100. | 0.0350 | 2.86 | 0.740 | 0.966 | 0.853 | ||
| HadGEM2-ES | [-] | 122. | 122. | 0.354 | 100. | 0.0350 | 2.96 | 0.745 | 0.964 | 0.855 | ||
| inmcm4 | [-] | 88.0 | 87.6 | 0.753 | 99.3 | 0.905 | -1.41 | 0.762 | 0.788 | 0.775 | ||
| IPSL-CM5A-LR | [-] | 88.9 | 87.5 | 0.590 | 100. | 0.0315 | -1.02 | 0.681 | 0.865 | 0.773 | ||
| IPSL-CM5A-MR | [-] | 81.8 | 80.6 | 0.498 | 100. | 0.0750 | -1.85 | 0.655 | 0.823 | 0.739 | ||
| MeanCMIP5 | [-] | 84.3 | 83.9 | 0.356 | 100. | -0.358 | 0.761 | 0.941 | 0.851 | |||
| MIROC-ESM | [-] | 50.8 | 48.6 | 0.313 | 99.2 | 1.00 | -6.10 | 0.587 | 0.780 | 0.684 | ||
| MIROC-ESM-CHEM | [-] | 57.2 | 54.7 | 0.453 | 99.2 | 1.00 | -5.35 | 0.606 | 0.880 | 0.743 | ||
| MPI-ESM-LR | [-] | 56.5 | 55.2 | 0.139 | 98.2 | 1.93 | -5.33 | 0.592 | 0.893 | 0.743 | ||
| MRI-ESM1 | [-] | 140. | 140. | 0.437 | 100. | 4.91 | 0.693 | 0.952 | 0.823 | |||
| NorESM1-M | [-] | 139. | 137. | 0.759 | 100. | 4.77 | 0.504 | 0.518 | 0.511 | |||
| NorESM1-ME | [-] | 141. | 140. | 0.786 | 100. | 5.04 | 0.505 | 0.512 | 0.509 |
Temporally integrated period mean