Mean State
Download Data |
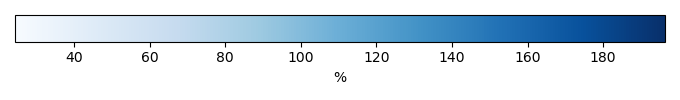
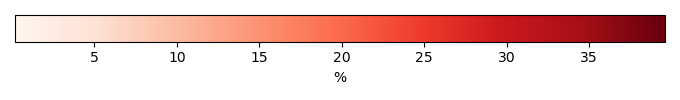
Period Mean (original grids) [%] |
Model Period Mean (intersection) [%] |
Model Period Mean (complement) [%] |
Benchmark Period Mean (intersection) [%] |
Benchmark Period Mean (complement) [%] |
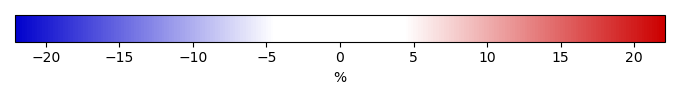
Bias [%] |
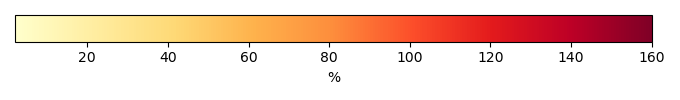
RMSE [%] |
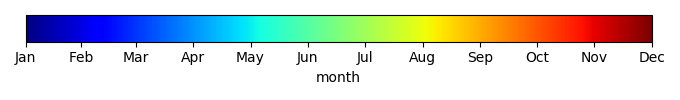
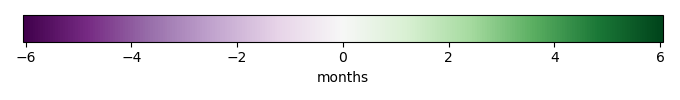
Phase Shift [months] |
Bias Score [1] |
RMSE Score [1] |
Seasonal Cycle Score [1] |
Spatial Distribution Score [1] |
Interannual Variability Score [1] |
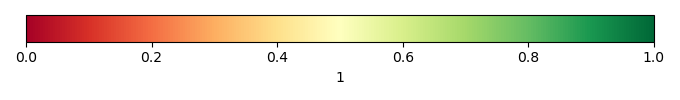
Overall Score [1] |
|||
|---|---|---|---|---|---|---|---|---|---|---|---|---|---|---|---|---|---|
| Benchmark | [-] | 65.8 | |||||||||||||||
| bcc-csm1-1 | [-] | 69.0 | 69.0 | 65.8 | 3.53 | 17.1 | 1.90 | 0.320 | 0.268 | 0.693 | 0.909 | 0.642 | 0.517 | ||||
| BNU-ESM | [-] | 72.3 | 72.3 | 65.8 | 7.65 | 16.6 | 1.74 | 0.338 | 0.286 | 0.728 | 0.923 | 0.721 | 0.547 | ||||
| CanESM2 | [-] | 74.9 | 74.8 | 65.8 | 9.98 | 15.0 | 1.40 | 0.360 | 0.359 | 0.800 | 0.866 | 0.755 | 0.583 | ||||
| CESM1-BGC | [-] | 72.2 | 72.2 | 65.8 | 7.36 | 13.9 | 1.74 | 0.436 | 0.318 | 0.717 | 0.982 | 0.788 | 0.593 | ||||
| GFDL-ESM2G | [-] | 69.5 | 69.4 | 65.8 | 4.94 | 16.5 | 1.70 | 0.351 | 0.264 | 0.738 | 0.904 | 0.634 | 0.526 | ||||
| GFDL-ESM2M | [-] | 69.3 | 69.3 | 65.8 | 4.72 | 17.0 | 1.70 | 0.347 | 0.250 | 0.738 | 0.901 | 0.572 | 0.510 | ||||
| HadGEM2-CC | [-] | 70.2 | 70.2 | 65.8 | 5.84 | 15.1 | 1.95 | 0.363 | 0.298 | 0.676 | 0.855 | 0.753 | 0.541 | ||||
| HadGEM2-ES | [-] | 70.0 | 69.9 | 65.8 | 5.57 | 14.9 | 1.92 | 0.374 | 0.299 | 0.682 | 0.855 | 0.752 | 0.544 | ||||
| inmcm4 | [-] | 78.6 | 78.6 | 65.8 | 13.2 | 20.1 | 2.28 | 0.305 | 0.262 | 0.617 | 0.411 | 0.648 | 0.418 | ||||
| IPSL-CM5A-LR | [-] | 67.9 | 67.8 | 65.8 | 3.51 | 14.7 | 1.87 | 0.369 | 0.298 | 0.696 | 0.926 | 0.782 | 0.561 | ||||
| IPSL-CM5A-MR | [-] | 66.9 | 66.8 | 65.8 | 2.65 | 14.1 | 1.80 | 0.381 | 0.305 | 0.707 | 0.921 | 0.787 | 0.568 | ||||
| MeanCMIP5 | [-] | 71.2 | 71.2 | 65.8 | 6.45 | 12.4 | 1.68 | 0.409 | 0.388 | 0.723 | 0.940 | 0.513 | 0.560 | ||||
| MIROC-ESM | [-] | 72.1 | 72.0 | 65.8 | 8.42 | 16.7 | 1.95 | 0.292 | 0.322 | 0.675 | 0.903 | 0.704 | 0.536 | ||||
| MIROC-ESM-CHEM | [-] | 72.1 | 72.0 | 65.8 | 8.42 | 16.6 | 1.96 | 0.296 | 0.320 | 0.676 | 0.903 | 0.708 | 0.537 | ||||
| MRI-ESM1 | [-] | 66.1 | 66.1 | 65.8 | 2.05 | 13.6 | 1.82 | 0.430 | 0.289 | 0.717 | 0.908 | 0.725 | 0.560 | ||||
| NorESM1-M | [-] | 72.5 | 72.4 | 65.8 | 7.70 | 15.2 | 1.82 | 0.383 | 0.310 | 0.710 | 0.971 | 0.785 | 0.578 | ||||
| NorESM1-ME | [-] | 72.4 | 72.3 | 65.8 | 7.60 | 15.2 | 1.80 | 0.383 | 0.309 | 0.710 | 0.969 | 0.783 | 0.577 |
Download Data |
Period Mean (original grids) [%] |
Model Period Mean (intersection) [%] |
Model Period Mean (complement) [%] |
Benchmark Period Mean (intersection) [%] |
Benchmark Period Mean (complement) [%] |
Bias [%] |
RMSE [%] |
Phase Shift [months] |
Bias Score [1] |
RMSE Score [1] |
Seasonal Cycle Score [1] |
Spatial Distribution Score [1] |
Interannual Variability Score [1] |
Overall Score [1] |
|||
|---|---|---|---|---|---|---|---|---|---|---|---|---|---|---|---|---|---|
| Benchmark | [-] | 85.2 | |||||||||||||||
| bcc-csm1-1 | [-] | 69.3 | 69.2 | 85.2 | -15.6 | 20.9 | 1.79 | 0.130 | 0.161 | 0.755 | 0.734 | 0.404 | 0.391 | ||||
| BNU-ESM | [-] | 79.5 | 79.7 | 85.2 | -5.53 | 13.3 | 1.28 | 0.362 | 0.191 | 0.836 | 0.771 | 0.630 | 0.497 | ||||
| CanESM2 | [-] | 73.0 | 72.7 | 85.2 | -11.7 | 17.1 | 1.26 | 0.240 | 0.214 | 0.849 | 0.789 | 0.563 | 0.478 | ||||
| CESM1-BGC | [-] | 81.4 | 81.4 | 85.2 | -3.72 | 9.41 | 1.71 | 0.490 | 0.281 | 0.753 | 0.788 | 0.719 | 0.552 | ||||
| GFDL-ESM2G | [-] | 66.9 | 67.0 | 85.2 | -17.3 | 24.9 | 1.29 | 0.136 | 0.0973 | 0.839 | 0.873 | 0.473 | 0.419 | ||||
| GFDL-ESM2M | [-] | 66.6 | 66.7 | 85.2 | -17.6 | 25.1 | 1.36 | 0.127 | 0.0962 | 0.830 | 0.814 | 0.332 | 0.382 | ||||
| HadGEM2-CC | [-] | 81.5 | 81.5 | 85.2 | -3.91 | 9.36 | 1.43 | 0.376 | 0.327 | 0.818 | 0.947 | 0.722 | 0.586 | ||||
| HadGEM2-ES | [-] | 81.5 | 81.5 | 85.2 | -3.96 | 9.33 | 1.46 | 0.370 | 0.335 | 0.814 | 0.955 | 0.726 | 0.589 | ||||
| inmcm4 | [-] | 87.1 | 87.4 | 85.2 | 1.98 | 10.1 | 2.83 | 0.444 | 0.264 | 0.534 | 0.853 | 0.597 | 0.493 | ||||
| IPSL-CM5A-LR | [-] | 69.3 | 69.2 | 85.2 | -14.9 | 18.3 | 1.31 | 0.174 | 0.218 | 0.835 | 0.885 | 0.660 | 0.498 | ||||
| IPSL-CM5A-MR | [-] | 68.3 | 68.4 | 85.2 | -15.8 | 18.9 | 1.39 | 0.157 | 0.216 | 0.818 | 0.850 | 0.644 | 0.484 | ||||
| MeanCMIP5 | [-] | 77.1 | 77.1 | 85.2 | -7.88 | 11.3 | 1.10 | 0.266 | 0.295 | 0.870 | 0.978 | 0.583 | 0.548 | ||||
| MIROC-ESM | [-] | 80.2 | 80.3 | 85.2 | -4.66 | 14.6 | 1.52 | 0.302 | 0.209 | 0.779 | 0.514 | 0.555 | 0.428 | ||||
| MIROC-ESM-CHEM | [-] | 80.6 | 80.7 | 85.2 | -4.29 | 14.1 | 1.42 | 0.331 | 0.215 | 0.802 | 0.536 | 0.604 | 0.450 | ||||
| MRI-ESM1 | [-] | 86.9 | 86.9 | 85.2 | 1.53 | 8.11 | 1.40 | 0.545 | 0.319 | 0.830 | 0.944 | 0.715 | 0.612 | ||||
| NorESM1-M | [-] | 79.5 | 79.5 | 85.2 | -5.75 | 11.8 | 1.79 | 0.407 | 0.239 | 0.748 | 0.659 | 0.716 | 0.501 | ||||
| NorESM1-ME | [-] | 79.3 | 79.2 | 85.2 | -5.96 | 12.0 | 1.67 | 0.403 | 0.240 | 0.766 | 0.620 | 0.712 | 0.497 |
Temporally integrated period mean