Mean State
Download Data |
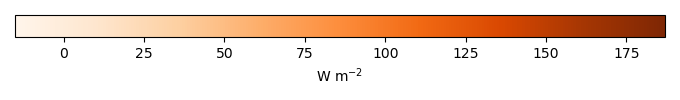
Period Mean (original grids) [W m-2] |
Model Period Mean (intersection) [W m-2] |
Model Period Mean (complement) [W m-2] |
Benchmark Period Mean (intersection) [W m-2] |
Benchmark Period Mean (complement) [W m-2] |
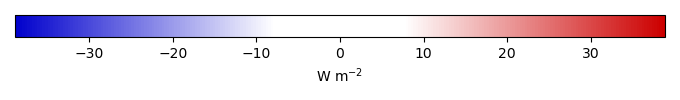
Bias [W m-2] |
RMSE [W m-2] |
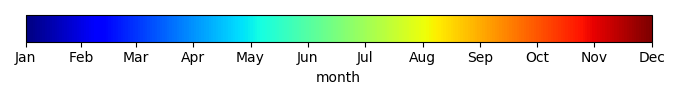
Phase Shift [months] |
Bias Score [1] |
RMSE Score [1] |
Seasonal Cycle Score [1] |
Spatial Distribution Score [1] |
Interannual Variability Score [1] |
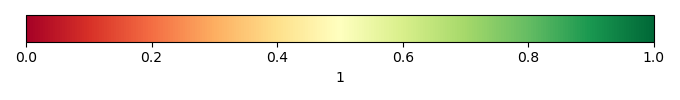
Overall Score [1] |
|||
|---|---|---|---|---|---|---|---|---|---|---|---|---|---|---|---|---|---|
| Benchmark | [-] | 31.7 | |||||||||||||||
| bcc-csm1-1 | [-] | 37.7 | 35.3 | 56.7 | 31.7 | 5.61 | 20.3 | 1.40 | 0.506 | 0.322 | 0.766 | 0.948 | 0.205 | 0.512 | |||
| bcc-csm1-1-m | [-] | 37.9 | 36.0 | 58.1 | 31.7 | 5.45 | 20.0 | 1.28 | 0.500 | 0.310 | 0.782 | 0.953 | 0.201 | 0.509 | |||
| BNU-ESM | [-] | 45.9 | 44.0 | 59.9 | 31.7 | 14.0 | 24.0 | 1.22 | 0.393 | 0.334 | 0.765 | 0.887 | 0.251 | 0.494 | |||
| CanESM2 | [-] | 34.6 | 33.8 | 39.5 | 31.7 | 4.35 | 21.3 | 1.32 | 0.490 | 0.298 | 0.742 | 0.926 | 0.153 | 0.484 | |||
| CESM1-BGC | [-] | 47.0 | 45.6 | 61.9 | 31.7 | 15.0 | 23.1 | 1.18 | 0.362 | 0.330 | 0.817 | 0.884 | 0.255 | 0.496 | |||
| GFDL-ESM2G | [-] | 44.4 | 42.4 | 61.3 | 31.7 | 12.2 | 26.0 | 1.30 | 0.429 | 0.263 | 0.773 | 0.916 | 0.119 | 0.461 | |||
| GFDL-ESM2M | [-] | 44.1 | 42.3 | 58.2 | 31.7 | 11.9 | 26.7 | 1.33 | 0.429 | 0.253 | 0.773 | 0.924 | 0.0967 | 0.455 | |||
| HadGEM2-CC | [-] | 43.6 | 42.5 | 55.3 | 31.8 | 11.5 | 21.9 | 1.22 | 0.404 | 0.327 | 0.798 | 0.911 | 0.246 | 0.502 | |||
| HadGEM2-ES | [-] | 44.7 | 43.6 | 56.8 | 31.8 | 12.7 | 22.5 | 1.20 | 0.390 | 0.327 | 0.802 | 0.906 | 0.249 | 0.500 | |||
| inmcm4 | [-] | 45.6 | 44.7 | 53.8 | 31.7 | 14.1 | 27.4 | 1.23 | 0.376 | 0.240 | 0.784 | 0.839 | 0.144 | 0.437 | |||
| IPSL-CM5A-LR | [-] | 37.7 | 35.7 | 53.0 | 31.7 | 6.08 | 19.2 | 1.16 | 0.449 | 0.367 | 0.788 | 0.927 | 0.399 | 0.550 | |||
| IPSL-CM5A-MR | [-] | 38.0 | 36.1 | 53.7 | 31.7 | 6.17 | 18.9 | 1.09 | 0.455 | 0.373 | 0.805 | 0.929 | 0.380 | 0.553 | |||
| MeanCMIP5 | [-] | 43.6 | 41.6 | 63.4 | 31.7 | 10.9 | 15.9 | 0.982 | 0.462 | 0.470 | 0.818 | 0.947 | 0.748 | 0.653 | |||
| MIROC-ESM | [-] | 45.5 | 45.1 | 49.8 | 31.7 | 15.9 | 26.4 | 1.26 | 0.363 | 0.340 | 0.759 | 0.846 | 0.305 | 0.492 | |||
| MIROC-ESM-CHEM | [-] | 45.5 | 45.1 | 49.5 | 31.7 | 15.8 | 26.2 | 1.28 | 0.366 | 0.344 | 0.758 | 0.846 | 0.307 | 0.494 | |||
| MPI-ESM-LR | [-] | 39.9 | 39.4 | 45.2 | 31.7 | 9.88 | 21.8 | 1.20 | 0.410 | 0.315 | 0.791 | 0.891 | 0.192 | 0.486 | |||
| MRI-ESM1 | [-] | 39.6 | 38.4 | 53.5 | 31.7 | 7.46 | 20.1 | 1.33 | 0.461 | 0.342 | 0.762 | 0.917 | 0.269 | 0.515 | |||
| NorESM1-M | [-] | 46.5 | 44.6 | 63.1 | 31.7 | 14.0 | 23.7 | 1.28 | 0.381 | 0.330 | 0.781 | 0.871 | 0.284 | 0.496 | |||
| NorESM1-ME | [-] | 46.3 | 44.4 | 63.3 | 31.7 | 13.7 | 23.9 | 1.30 | 0.378 | 0.327 | 0.783 | 0.870 | 0.263 | 0.491 |
Download Data |
Period Mean (original grids) [W m-2] |
Model Period Mean (intersection) [W m-2] |
Model Period Mean (complement) [W m-2] |
Benchmark Period Mean (intersection) [W m-2] |
Benchmark Period Mean (complement) [W m-2] |
Bias [W m-2] |
RMSE [W m-2] |
Phase Shift [months] |
Bias Score [1] |
RMSE Score [1] |
Seasonal Cycle Score [1] |
Spatial Distribution Score [1] |
Interannual Variability Score [1] |
Overall Score [1] |
|||
|---|---|---|---|---|---|---|---|---|---|---|---|---|---|---|---|---|---|
| Benchmark | [-] | 87.1 | |||||||||||||||
| bcc-csm1-1 | [-] | 69.7 | 69.4 | 70.5 | 87.1 | -17.1 | 36.8 | 2.12 | 0.172 | 0.0506 | 0.680 | 0.485 | 0.0768 | 0.253 | |||
| bcc-csm1-1-m | [-] | 74.3 | 74.2 | 76.7 | 87.1 | -12.5 | 37.0 | 1.80 | 0.162 | 0.0389 | 0.726 | 0.475 | 0.0839 | 0.254 | |||
| BNU-ESM | [-] | 99.4 | 100. | 88.5 | 87.1 | 12.7 | 35.6 | 2.47 | 0.199 | 0.0626 | 0.603 | 0.394 | 0.175 | 0.249 | |||
| CanESM2 | [-] | 63.7 | 63.8 | 50.8 | 87.1 | -22.9 | 47.0 | 3.33 | 0.143 | 0.0265 | 0.431 | 0.368 | 0.0636 | 0.176 | |||
| CESM1-BGC | [-] | 104. | 105. | 97.1 | 87.1 | 17.7 | 33.4 | 1.72 | 0.126 | 0.0595 | 0.755 | 0.441 | 0.167 | 0.268 | |||
| GFDL-ESM2G | [-] | 81.4 | 81.0 | 86.1 | 87.1 | -5.77 | 44.3 | 2.70 | 0.285 | 0.0167 | 0.562 | 0.637 | 0.0465 | 0.261 | |||
| GFDL-ESM2M | [-] | 79.6 | 79.9 | 72.4 | 87.1 | -7.34 | 45.7 | 2.58 | 0.269 | 0.0154 | 0.587 | 0.548 | 0.0188 | 0.242 | |||
| HadGEM2-CC | [-] | 109. | 110. | 96.3 | 87.1 | 22.2 | 33.1 | 1.69 | 0.105 | 0.128 | 0.746 | 0.459 | 0.219 | 0.297 | |||
| HadGEM2-ES | [-] | 110. | 111. | 99.7 | 87.1 | 23.4 | 32.5 | 1.75 | 0.109 | 0.132 | 0.744 | 0.506 | 0.257 | 0.313 | |||
| inmcm4 | [-] | 124. | 125. | 111. | 87.1 | 37.5 | 55.3 | 2.34 | 0.0699 | 0.0331 | 0.635 | 0.307 | 0.138 | 0.203 | |||
| IPSL-CM5A-LR | [-] | 89.7 | 89.6 | 86.1 | 87.1 | 2.53 | 35.8 | 2.84 | 0.147 | 0.0918 | 0.519 | 0.241 | 0.288 | 0.230 | |||
| IPSL-CM5A-MR | [-] | 88.6 | 88.3 | 85.5 | 87.1 | 1.57 | 38.9 | 2.55 | 0.104 | 0.0994 | 0.583 | 0.183 | 0.350 | 0.236 | |||
| MeanCMIP5 | [-] | 93.1 | 93.2 | 90.1 | 87.1 | 5.95 | 22.9 | 2.61 | 0.265 | 0.125 | 0.568 | 0.665 | 0.799 | 0.425 | |||
| MIROC-ESM | [-] | 93.1 | 94.2 | 75.6 | 87.1 | 7.10 | 36.5 | 2.64 | 0.184 | 0.0836 | 0.576 | 0.341 | 0.196 | 0.244 | |||
| MIROC-ESM-CHEM | [-] | 93.3 | 94.2 | 76.6 | 87.1 | 7.08 | 35.3 | 2.32 | 0.185 | 0.0829 | 0.643 | 0.352 | 0.202 | 0.258 | |||
| MPI-ESM-LR | [-] | 85.4 | 86.5 | 62.0 | 87.1 | -0.143 | 39.6 | 2.74 | 0.202 | 0.0452 | 0.551 | 0.272 | 0.0575 | 0.196 | |||
| MRI-ESM1 | [-] | 102. | 102. | 90.7 | 87.1 | 14.5 | 26.9 | 2.99 | 0.102 | 0.105 | 0.505 | 0.442 | 0.189 | 0.242 | |||
| NorESM1-M | [-] | 101. | 101. | 95.9 | 87.1 | 14.2 | 32.8 | 2.08 | 0.183 | 0.0690 | 0.681 | 0.456 | 0.202 | 0.277 | |||
| NorESM1-ME | [-] | 101. | 101. | 96.1 | 87.1 | 14.0 | 33.5 | 1.68 | 0.193 | 0.0679 | 0.753 | 0.446 | 0.176 | 0.284 |
Temporally integrated period mean