Mean State
Download Data |
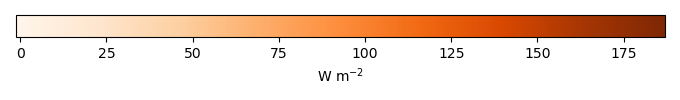
Period Mean (original grids) [W m-2] |
Model Period Mean (intersection) [W m-2] |
Model Period Mean (complement) [W m-2] |
Benchmark Period Mean (intersection) [W m-2] |
Benchmark Period Mean (complement) [W m-2] |
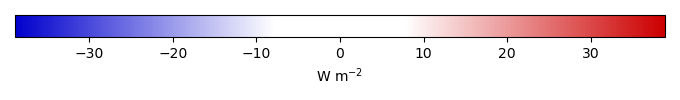
Bias [W m-2] |
RMSE [W m-2] |
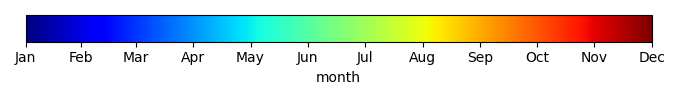
Phase Shift [months] |
Bias Score [1] |
RMSE Score [1] |
Seasonal Cycle Score [1] |
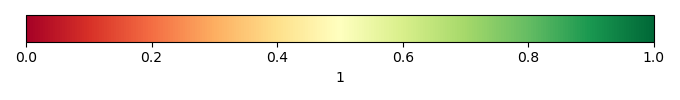
Spatial Distribution Score [1] |
Overall Score [1] |
|||
|---|---|---|---|---|---|---|---|---|---|---|---|---|---|---|---|---|
| Benchmark | [-] | 31.7 | ||||||||||||||
| bcc-csm1-1 | [-] | 37.7 | 35.3 | 56.7 | 31.7 | 5.61 | 17.5 | 1.40 | 0.506 | 0.411 | 0.766 | 0.948 | 0.608 | |||
| BCC-CSM2-MR | [-] | 41.7 | 39.9 | 61.1 | 31.7 | 9.19 | 16.0 | 1.15 | 0.491 | 0.443 | 0.800 | 0.931 | 0.622 | |||
| CanESM2 | [-] | 34.6 | 33.8 | 39.5 | 31.7 | 4.35 | 18.0 | 1.32 | 0.490 | 0.389 | 0.742 | 0.926 | 0.587 | |||
| CanESM5 | [-] | 44.3 | 42.1 | 61.9 | 31.7 | 12.5 | 22.1 | 1.30 | 0.373 | 0.370 | 0.783 | 0.881 | 0.556 | |||
| CESM1-BGC | [-] | 47.0 | 45.6 | 61.9 | 31.7 | 15.0 | 21.1 | 1.18 | 0.362 | 0.404 | 0.817 | 0.884 | 0.574 | |||
| CESM2 | [-] | 38.5 | 37.0 | 55.9 | 31.7 | 6.40 | 13.7 | 1.15 | 0.549 | 0.495 | 0.799 | 0.959 | 0.659 | |||
| GFDL-ESM2G | [-] | 44.4 | 42.4 | 61.3 | 31.7 | 12.2 | 22.5 | 1.30 | 0.429 | 0.343 | 0.773 | 0.916 | 0.561 | |||
| GFDL-ESM4 | [-] | 44.7 | 43.1 | 62.4 | 31.7 | 12.0 | 18.2 | 1.16 | 0.417 | 0.427 | 0.793 | 0.926 | 0.598 | |||
| IPSL-CM5A-LR | [-] | 37.7 | 35.7 | 53.0 | 31.7 | 6.08 | 17.5 | 1.16 | 0.449 | 0.436 | 0.788 | 0.927 | 0.607 | |||
| IPSL-CM6A-LR | [-] | 43.8 | 42.3 | 59.7 | 31.7 | 12.2 | 18.1 | 1.15 | 0.425 | 0.431 | 0.803 | 0.909 | 0.600 | |||
| MeanCMIP5 | [-] | 43.2 | 41.2 | 62.8 | 31.7 | 10.6 | 15.4 | 1.02 | 0.470 | 0.507 | 0.814 | 0.947 | 0.649 | |||
| MeanCMIP6 | [-] | 44.1 | 42.2 | 64.9 | 31.7 | 11.4 | 14.7 | 0.882 | 0.434 | 0.546 | 0.846 | 0.937 | 0.662 | |||
| MIROC-ES2L | [-] | 56.2 | 54.3 | 68.5 | 31.7 | 23.7 | 28.5 | 1.28 | 0.246 | 0.450 | 0.758 | 0.802 | 0.541 | |||
| MIROC-ESM | [-] | 45.5 | 45.1 | 49.8 | 31.7 | 15.9 | 24.5 | 1.26 | 0.363 | 0.414 | 0.759 | 0.846 | 0.559 | |||
| MPI-ESM-LR | [-] | 39.9 | 39.4 | 45.2 | 31.7 | 9.88 | 19.4 | 1.20 | 0.410 | 0.396 | 0.791 | 0.891 | 0.577 | |||
| MPI-ESM1.2-LR | [-] | 41.7 | 41.2 | 47.1 | 31.7 | 11.3 | 21.4 | 1.23 | 0.360 | 0.380 | 0.798 | 0.861 | 0.556 | |||
| NorESM1-ME | [-] | 46.3 | 44.4 | 63.3 | 31.7 | 13.7 | 22.0 | 1.30 | 0.378 | 0.398 | 0.783 | 0.870 | 0.566 | |||
| NorESM2-LM | [-] | 41.3 | 37.2 | 60.2 | 31.7 | 6.75 | 14.2 | 1.16 | 0.553 | 0.495 | 0.796 | 0.943 | 0.656 | |||
| UK-HadGEM2-ES | [-] | 44.7 | 43.6 | 56.8 | 31.8 | 12.7 | 20.2 | 1.20 | 0.390 | 0.408 | 0.802 | 0.906 | 0.582 | |||
| UKESM1-0-LL | [-] | 41.7 | 40.1 | 60.0 | 31.7 | 9.82 | 16.9 | 1.07 | 0.422 | 0.451 | 0.811 | 0.908 | 0.608 |
Temporally integrated period mean