Mean State
Download Data |
Period Mean (original grids) [Pg] |
Model Period Mean (intersection) [Pg] |
Benchmark Period Mean (intersection) [Pg] |
Model Period Mean (complement) [Pg] |
Benchmark Period Mean (complement) [Pg] |
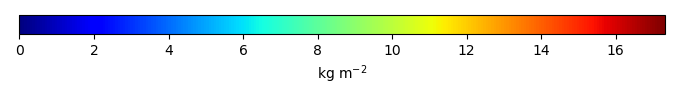
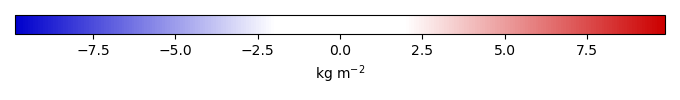
Bias [kg m-2] |
Bias Score [1] |
Spatial Distribution Score [1] |
Overall Score [1] |
|||
|---|---|---|---|---|---|---|---|---|---|---|---|---|
| Benchmark | [-] | 46.8 | ||||||||||
| bcc-csm1-1 | [-] | 68.5 | 65.3 | 46.8 | 2.93 | 0.0142 | 1.72 | 0.428 | 0.928 | 0.678 | ||
| BCC-CSM2-MR | [-] | 49.7 | 49.1 | 46.7 | 0.362 | 0.0429 | 0.239 | 0.607 | 0.952 | 0.779 | ||
| CanESM2 | [-] | 106. | 103. | 46.8 | 2.47 | 4.44 | 0.268 | 0.793 | 0.531 | |||
| CanESM5 | [-] | 94.5 | 91.7 | 46.8 | 2.16 | 3.96 | 0.323 | 0.856 | 0.589 | |||
| CESM1-BGC | [-] | 110. | 109. | 46.7 | 0.466 | 0.0977 | 5.20 | 0.470 | 0.400 | 0.435 | ||
| CESM2 | [-] | 64.3 | 63.2 | 46.7 | 0.444 | 0.0977 | 1.49 | 0.515 | 0.775 | 0.645 | ||
| GFDL-ESM2G | [-] | 95.1 | 95.8 | 46.8 | 1.92 | 4.33 | 0.284 | 0.801 | 0.542 | |||
| GFDL-ESM4 | [-] | 47.0 | 43.8 | 46.8 | 3.20 | -0.243 | 0.529 | 0.855 | 0.692 | |||
| IPSL-CM5A-LR | [-] | 78.1 | 74.9 | 46.7 | 2.70 | 0.0253 | 2.65 | 0.486 | 0.754 | 0.620 | ||
| IPSL-CM6A-LR | [-] | 59.8 | 59.5 | 46.7 | 0.645 | 0.0456 | 1.17 | 0.534 | 0.953 | 0.743 | ||
| MeanCMIP5 | [-] | 93.9 | 85.9 | 46.7 | 7.96 | 0.0930 | 3.17 | 0.372 | 0.847 | 0.610 | ||
| MeanCMIP6 | [-] | 66.7 | 66.0 | 46.8 | 0.698 | 1.79 | 0.522 | 0.949 | 0.735 | |||
| MIROC-ESM | [-] | 45.1 | 44.1 | 44.1 | 0.934 | 2.66 | -0.0146 | 0.433 | 0.703 | 0.568 | ||
| MIROC-ESM2L | [-] | 80.1 | 76.8 | 46.8 | 2.88 | 0.0131 | 2.78 | 0.341 | 0.887 | 0.614 | ||
| MPI-ESM-LR | [-] | 65.4 | 64.5 | 44.5 | 0.267 | 2.31 | 1.73 | 0.481 | 0.901 | 0.691 | ||
| NorESM1-ME | [-] | 121. | 118. | 46.8 | 1.99 | 6.08 | 0.434 | 0.363 | 0.399 | |||
| NorESM2-LM | [-] | 53.1 | 51.3 | 46.8 | 1.11 | 0.620 | 0.518 | 0.821 | 0.670 | |||
| UK-HadGEM2-ES | [-] | 59.9 | 60.4 | 46.7 | 0.700 | 0.0309 | 1.37 | 0.473 | 0.886 | 0.680 | ||
| UKESM1-0-LL | [-] | 67.8 | 66.3 | 46.7 | 0.510 | 0.0469 | 1.78 | 0.486 | 0.870 | 0.678 |
Download Data |
Period Mean (original grids) [Pg] |
Model Period Mean (intersection) [Pg] |
Benchmark Period Mean (intersection) [Pg] |
Model Period Mean (complement) [Pg] |
Benchmark Period Mean (complement) [Pg] |
Bias [kg m-2] |
Bias Score [1] |
Spatial Distribution Score [1] |
Overall Score [1] |
|||
|---|---|---|---|---|---|---|---|---|---|---|---|---|
| Benchmark | [-] | 28.3 | ||||||||||
| bcc-csm1-1 | [-] | 29.3 | 23.4 | 28.1 | 5.60 | 0.178 | 3.76 | 0.384 | 0.725 | 0.554 | ||
| BCC-CSM2-MR | [-] | 28.7 | 26.8 | 27.6 | 1.57 | 0.634 | 1.64 | 0.459 | 0.903 | 0.681 | ||
| CanESM2 | [-] | 60.8 | 49.0 | 28.3 | 11.4 | 3.94 | 0.327 | 0.681 | 0.504 | |||
| CanESM5 | [-] | 39.4 | 31.5 | 28.3 | 7.51 | 7.31 | 0.266 | 0.865 | 0.566 | |||
| CESM1-BGC | [-] | 73.3 | 70.3 | 26.7 | 3.52 | 1.55 | 20.0 | 0.0214 | 0.747 | 0.384 | ||
| CESM2 | [-] | 45.5 | 43.7 | 26.7 | 1.98 | 1.55 | 9.59 | 0.175 | 0.904 | 0.540 | ||
| GFDL-ESM2G | [-] | 46.5 | 39.9 | 28.3 | 7.63 | 10.0 | 0.181 | 0.839 | 0.510 | |||
| GFDL-ESM4 | [-] | 64.7 | 46.0 | 28.3 | 18.7 | 3.43 | 0.400 | 0.799 | 0.599 | |||
| IPSL-CM5A-LR | [-] | 66.0 | 50.7 | 27.4 | 12.6 | 0.829 | 16.5 | 0.0642 | 0.840 | 0.452 | ||
| IPSL-CM6A-LR | [-] | 26.9 | 24.0 | 27.8 | 3.46 | 0.437 | 3.69 | 0.355 | 0.645 | 0.500 | ||
| MeanCMIP5 | [-] | 122. | 81.4 | 28.3 | 40.5 | 10.2 | 0.143 | 0.873 | 0.508 | |||
| MeanCMIP6 | [-] | 33.9 | 30.8 | 28.3 | 3.08 | 5.19 | 0.351 | 0.859 | 0.605 | |||
| MIROC-ESM | [-] | 25.3 | 21.8 | 18.6 | 3.24 | 9.64 | 1.38 | 0.331 | 0.604 | 0.467 | ||
| MIROC-ESM2L | [-] | 27.6 | 19.3 | 28.0 | 7.77 | 0.286 | 2.57 | 0.312 | 0.516 | 0.414 | ||
| MPI-ESM-LR | [-] | 25.5 | 23.3 | 17.5 | 2.41 | 10.8 | 2.88 | 0.442 | 0.743 | 0.593 | ||
| NorESM1-ME | [-] | 83.2 | 74.1 | 28.3 | 10.2 | 19.2 | 0.0756 | 0.410 | 0.243 | |||
| NorESM2-LM | [-] | 46.4 | 40.8 | 28.3 | 5.98 | 9.40 | 0.167 | 0.844 | 0.506 | |||
| UK-HadGEM2-ES | [-] | 38.9 | 35.9 | 27.5 | 3.53 | 0.805 | 8.24 | 0.245 | 0.682 | 0.463 | ||
| UKESM1-0-LL | [-] | 40.1 | 35.0 | 27.7 | 4.18 | 0.613 | 7.58 | 0.264 | 0.564 | 0.414 |
Download Data |
Period Mean (original grids) [Pg] |
Model Period Mean (intersection) [Pg] |
Benchmark Period Mean (intersection) [Pg] |
Model Period Mean (complement) [Pg] |
Benchmark Period Mean (complement) [Pg] |
Bias [kg m-2] |
Bias Score [1] |
Spatial Distribution Score [1] |
Overall Score [1] |
|||
|---|---|---|---|---|---|---|---|---|---|---|---|---|
| Benchmark | [-] | 364. | ||||||||||
| bcc-csm1-1 | [-] | 476. | 442. | 364. | 25.8 | 0.286 | 1.17 | 0.405 | 0.817 | 0.611 | ||
| BCC-CSM2-MR | [-] | 386. | 379. | 362. | 6.48 | 1.90 | 0.320 | 0.529 | 0.898 | 0.714 | ||
| CanESM2 | [-] | 529. | 496. | 364. | 19.8 | 1.05 | 0.432 | 0.757 | 0.594 | |||
| CanESM5 | [-] | 509. | 485. | 364. | 15.9 | 1.71 | 0.372 | 0.809 | 0.590 | |||
| CESM1-BGC | [-] | 529. | 521. | 362. | 6.97 | 2.20 | 1.79 | 0.509 | 0.552 | 0.531 | ||
| CESM2 | [-] | 485. | 476. | 362. | 7.03 | 2.19 | 1.40 | 0.504 | 0.787 | 0.645 | ||
| GFDL-ESM2G | [-] | 655. | 621. | 364. | 25.5 | 2.87 | 0.325 | 0.781 | 0.553 | |||
| GFDL-ESM4 | [-] | 405. | 372. | 364. | 33.6 | 0.0539 | 0.500 | 0.812 | 0.656 | |||
| IPSL-CM5A-LR | [-] | 622. | 590. | 363. | 21.6 | 1.23 | 2.66 | 0.439 | 0.665 | 0.552 | ||
| IPSL-CM6A-LR | [-] | 350. | 342. | 362. | 6.61 | 2.07 | 0.191 | 0.549 | 0.881 | 0.715 | ||
| MeanCMIP5 | [-] | 605. | 553. | 364. | 51.9 | 0.259 | 1.53 | 0.411 | 0.873 | 0.642 | ||
| MeanCMIP6 | [-] | 460. | 450. | 364. | 9.70 | 1.21 | 0.492 | 0.916 | 0.704 | |||
| MIROC-ESM | [-] | 349. | 334. | 331. | 12.8 | 32.8 | 0.0179 | 0.447 | 0.745 | 0.596 | ||
| MIROC-ESM2L | [-] | 520. | 489. | 364. | 20.0 | 0.411 | 1.55 | 0.434 | 0.839 | 0.636 | ||
| MPI-ESM-LR | [-] | 335. | 325. | 337. | 8.08 | 27.2 | -0.105 | 0.485 | 0.809 | 0.647 | ||
| NorESM1-ME | [-] | 548. | 526. | 364. | 14.7 | 2.01 | 0.489 | 0.510 | 0.500 | |||
| NorESM2-LM | [-] | 463. | 444. | 364. | 12.9 | 1.35 | 0.502 | 0.794 | 0.648 | |||
| UK-HadGEM2-ES | [-] | 453. | 439. | 362. | 11.6 | 2.44 | 1.18 | 0.498 | 0.824 | 0.661 | ||
| UKESM1-0-LL | [-] | 545. | 531. | 362. | 10.9 | 2.52 | 2.05 | 0.457 | 0.799 | 0.628 |
Download Data |
Period Mean (original grids) [Pg] |
Model Period Mean (intersection) [Pg] |
Benchmark Period Mean (intersection) [Pg] |
Model Period Mean (complement) [Pg] |
Benchmark Period Mean (complement) [Pg] |
Bias [kg m-2] |
Bias Score [1] |
Spatial Distribution Score [1] |
Overall Score [1] |
|||
|---|---|---|---|---|---|---|---|---|---|---|---|---|
| Benchmark | [-] | 78.4 | ||||||||||
| bcc-csm1-1 | [-] | 66.5 | 65.6 | 78.4 | 1.83 | 0.0295 | -0.258 | 0.549 | 0.728 | 0.639 | ||
| BCC-CSM2-MR | [-] | 81.3 | 83.6 | 78.2 | 0.792 | 0.239 | 0.252 | 0.519 | 0.883 | 0.701 | ||
| CanESM2 | [-] | 114. | 112. | 78.4 | 3.39 | 1.04 | 0.453 | 0.699 | 0.576 | |||
| CanESM5 | [-] | 87.0 | 86.6 | 78.4 | 1.65 | 0.501 | 0.441 | 0.764 | 0.603 | |||
| CESM1-BGC | [-] | 31.6 | 31.3 | 78.1 | 0.236 | 0.335 | -1.50 | 0.521 | 0.512 | 0.517 | ||
| CESM2 | [-] | 111. | 110. | 78.1 | 0.744 | 0.335 | 1.21 | 0.445 | 0.762 | 0.603 | ||
| GFDL-ESM2G | [-] | 181. | 176. | 78.4 | 8.22 | 3.71 | 0.214 | 0.802 | 0.508 | |||
| GFDL-ESM4 | [-] | 162. | 131. | 78.4 | 31.2 | 1.66 | 0.316 | 0.799 | 0.558 | |||
| IPSL-CM5A-LR | [-] | 216. | 202. | 78.4 | 5.70 | 0.0483 | 4.31 | 0.229 | 0.515 | 0.372 | ||
| IPSL-CM6A-LR | [-] | 34.4 | 34.1 | 78.0 | 0.463 | 0.376 | -1.35 | 0.547 | 0.513 | 0.530 | ||
| MeanCMIP5 | [-] | 105. | 94.8 | 78.4 | 10.6 | 0.0334 | 0.525 | 0.450 | 0.799 | 0.624 | ||
| MeanCMIP6 | [-] | 81.6 | 80.7 | 78.4 | 0.897 | 0.259 | 0.540 | 0.896 | 0.718 | |||
| MIROC-ESM | [-] | 80.4 | 79.7 | 75.1 | 1.61 | 3.34 | 0.154 | 0.445 | 0.849 | 0.647 | ||
| MIROC-ESM2L | [-] | 90.2 | 89.4 | 78.4 | 2.04 | 0.00542 | 0.472 | 0.462 | 0.819 | 0.640 | ||
| MPI-ESM-LR | [-] | 42.7 | 43.4 | 76.5 | 0.252 | 1.95 | -1.13 | 0.505 | 0.593 | 0.549 | ||
| NorESM1-ME | [-] | 35.9 | 33.2 | 78.4 | 0.366 | -1.38 | 0.526 | 0.558 | 0.542 | |||
| NorESM2-LM | [-] | 98.4 | 92.8 | 78.4 | 1.28 | 0.816 | 0.460 | 0.773 | 0.617 | |||
| UK-HadGEM2-ES | [-] | 50.8 | 51.1 | 77.8 | 1.72 | 0.610 | -0.695 | 0.512 | 0.786 | 0.649 | ||
| UKESM1-0-LL | [-] | 71.0 | 69.9 | 78.0 | 1.08 | 0.376 | -0.0137 | 0.490 | 0.854 | 0.672 |
Download Data |
Period Mean (original grids) [Pg] |
Model Period Mean (intersection) [Pg] |
Benchmark Period Mean (intersection) [Pg] |
Model Period Mean (complement) [Pg] |
Benchmark Period Mean (complement) [Pg] |
Bias [kg m-2] |
Bias Score [1] |
Spatial Distribution Score [1] |
Overall Score [1] |
|||
|---|---|---|---|---|---|---|---|---|---|---|---|---|
| Benchmark | [-] | 88.9 | ||||||||||
| bcc-csm1-1 | [-] | 71.8 | 68.1 | 88.9 | 0.329 | 0.0278 | -2.08 | 0.371 | 0.760 | 0.566 | ||
| BCC-CSM2-MR | [-] | 76.9 | 76.8 | 88.8 | 0.178 | 0.135 | -1.27 | 0.395 | 0.810 | 0.603 | ||
| CanESM2 | [-] | 41.9 | 37.5 | 88.9 | 0.230 | -6.00 | 0.241 | 0.749 | 0.495 | |||
| CanESM5 | [-] | 60.0 | 55.9 | 88.9 | 0.292 | -3.49 | 0.328 | 0.813 | 0.571 | |||
| CESM1-BGC | [-] | 151. | 150. | 88.8 | 0.191 | 0.0655 | 7.49 | 0.153 | 0.581 | 0.367 | ||
| CESM2 | [-] | 130. | 129. | 88.8 | 0.290 | 0.0655 | 5.10 | 0.210 | 0.890 | 0.550 | ||
| GFDL-ESM2G | [-] | 73.9 | 75.0 | 88.9 | 0.447 | -1.26 | 0.342 | 0.843 | 0.592 | |||
| GFDL-ESM4 | [-] | 57.1 | 56.4 | 88.9 | 0.794 | -3.78 | 0.277 | 0.763 | 0.520 | |||
| IPSL-CM5A-LR | [-] | 89.1 | 87.6 | 88.9 | 0.515 | 0.0223 | 0.341 | 0.314 | 0.879 | 0.597 | ||
| IPSL-CM6A-LR | [-] | 101. | 100. | 88.8 | 0.345 | 0.0571 | 1.69 | 0.480 | 0.933 | 0.706 | ||
| MeanCMIP5 | [-] | 91.9 | 90.4 | 88.9 | 1.51 | 0.172 | 0.396 | 0.898 | 0.647 | |||
| MeanCMIP6 | [-] | 99.8 | 99.4 | 88.9 | 0.429 | 1.63 | 0.453 | 0.806 | 0.630 | |||
| MIROC-ESM | [-] | 50.6 | 48.4 | 88.1 | 0.296 | 0.742 | -4.78 | 0.312 | 0.703 | 0.508 | ||
| MIROC-ESM2L | [-] | 91.7 | 87.5 | 88.9 | 0.848 | 0.0239 | 0.275 | 0.406 | 0.735 | 0.571 | ||
| MPI-ESM-LR | [-] | 56.4 | 55.1 | 87.4 | 0.129 | 1.52 | -3.99 | 0.309 | 0.858 | 0.584 | ||
| NorESM1-ME | [-] | 141. | 140. | 88.9 | 0.709 | 6.36 | 0.174 | 0.567 | 0.370 | |||
| NorESM2-LM | [-] | 130. | 128. | 88.9 | 0.841 | 5.33 | 0.238 | 0.948 | 0.593 | |||
| UK-HadGEM2-ES | [-] | 122. | 122. | 88.9 | 0.330 | 0.0279 | 4.27 | 0.253 | 0.927 | 0.590 | ||
| UKESM1-0-LL | [-] | 115. | 115. | 88.8 | 0.394 | 0.118 | 3.51 | 0.333 | 0.818 | 0.576 |
Temporally integrated period mean