Mean State
Download Data |
Period Mean (original grids) [W m-2] |
Model Period Mean (intersection) [W m-2] |
Benchmark Period Mean (intersection) [W m-2] |
Model Period Mean (complement) [W m-2] |
Benchmark Period Mean (complement) [W m-2] |
Bias [W m-2] |
RMSE [W m-2] |
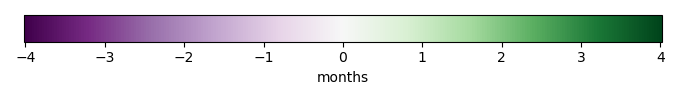
Phase Shift [months] |
Bias Score [1] |
RMSE Score [1] |
Seasonal Cycle Score [1] |
Spatial Distribution Score [1] |
Overall Score [1] |
|||
|---|---|---|---|---|---|---|---|---|---|---|---|---|---|---|---|---|
| Benchmark | [-] | 400. | ||||||||||||||
| bcc-csm1-1 | [-] | 385. | 385. | 400. | -4.81 | 12.6 | 1.80 | 0.358 | 0.544 | 0.741 | 0.974 | 0.632 | ||||
| BCC-CSM2-MR | [-] | 389. | 389. | 400. | -0.503 | 12.2 | 1.55 | 0.505 | 0.525 | 0.779 | 0.946 | 0.656 | ||||
| CanESM2 | [-] | 387. | 387. | 400. | -4.31 | 16.7 | 1.94 | 0.350 | 0.201 | 0.702 | 0.965 | 0.484 | ||||
| CanESM5 | [-] | 384. | 384. | 400. | -4.32 | 20.1 | 2.08 | 0.295 | 0.200 | 0.678 | 0.880 | 0.450 | ||||
| CESM1-BGC | [-] | 385. | 386. | 400. | -2.45 | 13.6 | 2.10 | 0.410 | 0.397 | 0.684 | 0.941 | 0.566 | ||||
| CESM2 | [-] | 398. | 398. | 400. | 6.56 | 13.0 | 1.41 | 0.489 | 0.434 | 0.821 | 0.997 | 0.635 | ||||
| GFDL-ESM2G | [-] | 380. | 380. | 400. | -9.03 | 15.3 | 1.80 | 0.250 | 0.423 | 0.727 | 0.981 | 0.561 | ||||
| GFDL-ESM4 | [-] | 397. | 397. | 400. | -2.87 | 10.6 | 1.06 | 0.498 | 0.488 | 0.871 | 0.994 | 0.668 | ||||
| IPSL-CM5A-LR | [-] | 362. | 361. | 400. | -26.2 | 28.7 | 2.69 | 0.0248 | 0.344 | 0.574 | 0.889 | 0.435 | ||||
| IPSL-CM6A-LR | [-] | 381. | 382. | 400. | -6.09 | 13.4 | 2.52 | 0.308 | 0.461 | 0.599 | 0.941 | 0.554 | ||||
| MeanCMIP5 | [-] | 391. | 391. | 400. | 410. | -8.98 | 13.4 | 1.67 | 0.276 | 0.494 | 0.762 | 0.980 | 0.601 | |||
| MeanCMIP6 | [-] | 389. | 389. | 400. | -1.07 | 10.5 | 1.13 | 0.528 | 0.511 | 0.858 | 0.987 | 0.679 | ||||
| MIROC-ESM | [-] | 377. | 377. | 400. | -12.2 | 16.2 | 1.85 | 0.210 | 0.542 | 0.736 | 0.991 | 0.604 | ||||
| MIROC-ESM2L | [-] | 394. | 394. | 400. | 2.17 | 12.4 | 1.42 | 0.447 | 0.569 | 0.805 | 1.00 | 0.678 | ||||
| MPI-ESM-LR | [-] | 384. | 385. | 400. | -6.35 | 13.7 | 1.79 | 0.416 | 0.419 | 0.732 | 0.992 | 0.596 | ||||
| MPI-ESM1.2-HR | [-] | 387. | 388. | 400. | -2.96 | 11.0 | 1.15 | 0.535 | 0.476 | 0.851 | 0.992 | 0.666 | ||||
| NorESM1-ME | [-] | 383. | 382. | 400. | -5.88 | 14.9 | 2.30 | 0.296 | 0.393 | 0.638 | 0.941 | 0.532 | ||||
| NorESM2-LM | [-] | 394. | 393. | 400. | 2.31 | 13.8 | 1.68 | 0.436 | 0.358 | 0.773 | 0.989 | 0.583 | ||||
| UK-HadGEM2-ES | [-] | 380. | 380. | 400. | -10.2 | 13.7 | 1.66 | 0.285 | 0.482 | 0.760 | 0.971 | 0.596 | ||||
| UKESM1-0-LL | [-] | 385. | 385. | 400. | -4.53 | 11.4 | 1.40 | 0.414 | 0.533 | 0.813 | 0.937 | 0.646 |
Download Data |
Period Mean (original grids) [W m-2] |
Model Period Mean (intersection) [W m-2] |
Benchmark Period Mean (intersection) [W m-2] |
Model Period Mean (complement) [W m-2] |
Benchmark Period Mean (complement) [W m-2] |
Bias [W m-2] |
RMSE [W m-2] |
Phase Shift [months] |
Bias Score [1] |
RMSE Score [1] |
Seasonal Cycle Score [1] |
Spatial Distribution Score [1] |
Overall Score [1] |
|||
|---|---|---|---|---|---|---|---|---|---|---|---|---|---|---|---|---|
| Benchmark | [-] | 419. | ||||||||||||||
| bcc-csm1-1 | [-] | 416. | 416. | 419. | -0.923 | 9.09 | 2.51 | 0.397 | 0.587 | 0.597 | 0.779 | 0.589 | ||||
| BCC-CSM2-MR | [-] | 417. | 417. | 419. | 6.39 | 9.84 | 2.51 | 0.337 | 0.711 | 0.601 | 0.916 | 0.655 | ||||
| CanESM2 | [-] | 422. | 422. | 419. | 0.947 | 9.45 | 2.85 | 0.386 | 0.672 | 0.524 | 0.537 | 0.558 | ||||
| CanESM5 | [-] | 423. | 423. | 419. | 6.54 | 9.16 | 3.01 | 0.291 | 0.746 | 0.493 | 0.489 | 0.553 | ||||
| CESM1-BGC | [-] | 417. | 417. | 419. | 4.73 | 7.80 | 2.77 | 0.397 | 0.725 | 0.551 | 0.901 | 0.660 | ||||
| CESM2 | [-] | 423. | 423. | 419. | 10.2 | 12.5 | 1.75 | 0.203 | 0.679 | 0.763 | 0.914 | 0.648 | ||||
| GFDL-ESM2G | [-] | 416. | 416. | 419. | -0.806 | 8.09 | 2.82 | 0.449 | 0.702 | 0.530 | 0.634 | 0.603 | ||||
| GFDL-ESM4 | [-] | 417. | 417. | 419. | -1.64 | 6.94 | 1.26 | 0.546 | 0.717 | 0.855 | 0.857 | 0.738 | ||||
| IPSL-CM5A-LR | [-] | 401. | 401. | 419. | -14.8 | 16.7 | 2.84 | 0.251 | 0.757 | 0.540 | 0.807 | 0.622 | ||||
| IPSL-CM6A-LR | [-] | 417. | 417. | 419. | 1.78 | 8.34 | 3.25 | 0.399 | 0.788 | 0.444 | 0.692 | 0.622 | ||||
| MeanCMIP5 | [-] | 416. | 416. | 419. | -3.14 | 7.54 | 2.64 | 0.490 | 0.792 | 0.563 | 0.533 | 0.634 | ||||
| MeanCMIP6 | [-] | 418. | 418. | 419. | 3.85 | 6.61 | 1.65 | 0.425 | 0.798 | 0.767 | 0.663 | 0.690 | ||||
| MIROC-ESM | [-] | 406. | 406. | 419. | -10.8 | 15.1 | 3.14 | 0.291 | 0.664 | 0.486 | 0.403 | 0.502 | ||||
| MIROC-ESM2L | [-] | 422. | 422. | 419. | 3.56 | 9.52 | 2.06 | 0.374 | 0.660 | 0.695 | 0.449 | 0.568 | ||||
| MPI-ESM-LR | [-] | 411. | 411. | 419. | -2.26 | 8.85 | 2.75 | 0.462 | 0.678 | 0.556 | 0.776 | 0.630 | ||||
| MPI-ESM1.2-HR | [-] | 405. | 405. | 419. | -3.86 | 8.14 | 1.53 | 0.472 | 0.692 | 0.817 | 0.961 | 0.727 | ||||
| NorESM1-ME | [-] | 416. | 416. | 419. | 0.253 | 6.78 | 2.96 | 0.474 | 0.722 | 0.510 | 0.707 | 0.627 | ||||
| NorESM2-LM | [-] | 426. | 426. | 419. | 11.4 | 12.5 | 3.22 | 0.169 | 0.777 | 0.481 | 0.558 | 0.552 | ||||
| UK-HadGEM2-ES | [-] | 408. | 408. | 419. | -4.43 | 9.49 | 2.33 | 0.471 | 0.657 | 0.636 | 0.843 | 0.653 | ||||
| UKESM1-0-LL | [-] | 414. | 414. | 419. | 0.604 | 7.84 | 1.13 | 0.469 | 0.640 | 0.853 | 0.928 | 0.706 |
Download Data |
Period Mean (original grids) [W m-2] |
Model Period Mean (intersection) [W m-2] |
Benchmark Period Mean (intersection) [W m-2] |
Model Period Mean (complement) [W m-2] |
Benchmark Period Mean (complement) [W m-2] |
Bias [W m-2] |
RMSE [W m-2] |
Phase Shift [months] |
Bias Score [1] |
RMSE Score [1] |
Seasonal Cycle Score [1] |
Spatial Distribution Score [1] |
Overall Score [1] |
|||
|---|---|---|---|---|---|---|---|---|---|---|---|---|---|---|---|---|
| Benchmark | [-] | 317. | ||||||||||||||
| bcc-csm1-1 | [-] | 309. | 309. | 317. | -4.02 | 19.6 | 0.870 | 0.332 | 0.367 | 0.891 | 0.994 | 0.590 | ||||
| BCC-CSM2-MR | [-] | 307. | 307. | 317. | -4.97 | 15.4 | 0.805 | 0.414 | 0.453 | 0.899 | 0.998 | 0.643 | ||||
| CanESM2 | [-] | 305. | 304. | 317. | -8.32 | 18.7 | 0.880 | 0.362 | 0.379 | 0.887 | 0.998 | 0.601 | ||||
| CanESM5 | [-] | 303. | 302. | 317. | -8.59 | 19.9 | 0.933 | 0.333 | 0.393 | 0.883 | 0.999 | 0.600 | ||||
| CESM1-BGC | [-] | 304. | 304. | 317. | -7.78 | 15.5 | 0.844 | 0.381 | 0.459 | 0.888 | 0.999 | 0.637 | ||||
| CESM2 | [-] | 313. | 313. | 317. | 1.87 | 15.2 | 0.765 | 0.414 | 0.438 | 0.910 | 0.997 | 0.639 | ||||
| GFDL-ESM2G | [-] | 307. | 307. | 317. | -5.02 | 17.2 | 0.792 | 0.388 | 0.423 | 0.897 | 0.998 | 0.626 | ||||
| GFDL-ESM4 | [-] | 313. | 313. | 317. | -3.89 | 13.9 | 0.653 | 0.462 | 0.469 | 0.930 | 0.999 | 0.666 | ||||
| IPSL-CM5A-LR | [-] | 288. | 288. | 317. | -23.1 | 28.2 | 0.986 | 0.105 | 0.342 | 0.871 | 0.998 | 0.531 | ||||
| IPSL-CM6A-LR | [-] | 303. | 303. | 317. | -7.37 | 17.7 | 1.07 | 0.358 | 0.435 | 0.858 | 0.998 | 0.617 | ||||
| MeanCMIP5 | [-] | 309. | 309. | 317. | 342. | -8.56 | 15.0 | 0.758 | 0.378 | 0.536 | 0.901 | 0.999 | 0.670 | |||
| MeanCMIP6 | [-] | 309. | 309. | 317. | -3.03 | 12.3 | 0.668 | 0.462 | 0.584 | 0.919 | 0.999 | 0.710 | ||||
| MIROC-ESM | [-] | 306. | 305. | 317. | -6.44 | 20.5 | 0.831 | 0.278 | 0.393 | 0.898 | 0.998 | 0.592 | ||||
| MIROC-ESM2L | [-] | 318. | 317. | 317. | 3.81 | 17.3 | 0.719 | 0.396 | 0.490 | 0.910 | 0.994 | 0.656 | ||||
| MPI-ESM-LR | [-] | 317. | 309. | 317. | -2.44 | 14.9 | 0.748 | 0.399 | 0.481 | 0.911 | 0.999 | 0.654 | ||||
| MPI-ESM1.2-HR | [-] | 310. | 310. | 317. | -1.35 | 13.8 | 0.675 | 0.423 | 0.494 | 0.922 | 0.999 | 0.666 | ||||
| NorESM1-ME | [-] | 302. | 302. | 317. | -10.5 | 18.9 | 0.928 | 0.300 | 0.401 | 0.879 | 0.999 | 0.596 | ||||
| NorESM2-LM | [-] | 314. | 314. | 317. | 0.861 | 17.3 | 0.829 | 0.339 | 0.424 | 0.897 | 0.998 | 0.617 | ||||
| UK-HadGEM2-ES | [-] | 303. | 303. | 317. | -9.06 | 16.1 | 0.770 | 0.333 | 0.491 | 0.906 | 0.998 | 0.644 | ||||
| UKESM1-0-LL | [-] | 303. | 303. | 317. | -7.78 | 14.8 | 0.790 | 0.360 | 0.506 | 0.914 | 0.999 | 0.657 |
Download Data |
Period Mean (original grids) [W m-2] |
Model Period Mean (intersection) [W m-2] |
Benchmark Period Mean (intersection) [W m-2] |
Model Period Mean (complement) [W m-2] |
Benchmark Period Mean (complement) [W m-2] |
Bias [W m-2] |
RMSE [W m-2] |
Phase Shift [months] |
Bias Score [1] |
RMSE Score [1] |
Seasonal Cycle Score [1] |
Spatial Distribution Score [1] |
Overall Score [1] |
|||
|---|---|---|---|---|---|---|---|---|---|---|---|---|---|---|---|---|
| Benchmark | [-] | 264. | ||||||||||||||
| bcc-csm1-1 | [-] | 264. | 264. | 264. | -0.0890 | 19.9 | 0.321 | 0.327 | 0.175 | 0.978 | 0.984 | 0.528 | ||||
| BCC-CSM2-MR | [-] | 257. | 258. | 264. | -2.13 | 14.5 | 0.276 | 0.506 | 0.308 | 0.981 | 0.993 | 0.619 | ||||
| CanESM2 | [-] | 256. | 256. | 264. | -2.41 | 15.5 | 0.232 | 0.529 | 0.349 | 0.984 | 0.997 | 0.641 | ||||
| CanESM5 | [-] | 256. | 256. | 264. | -4.06 | 14.7 | 0.308 | 0.510 | 0.398 | 0.979 | 0.997 | 0.656 | ||||
| CESM1-BGC | [-] | 251. | 251. | 264. | -7.55 | 13.3 | 0.294 | 0.467 | 0.438 | 0.980 | 0.996 | 0.664 | ||||
| CESM2 | [-] | 266. | 266. | 264. | 9.98 | 16.7 | 0.304 | 0.262 | 0.359 | 0.979 | 0.999 | 0.592 | ||||
| GFDL-ESM2G | [-] | 255. | 256. | 264. | -6.08 | 16.5 | 0.350 | 0.534 | 0.340 | 0.976 | 0.995 | 0.637 | ||||
| GFDL-ESM4 | [-] | 266. | 266. | 264. | 1.68 | 14.2 | 0.328 | 0.469 | 0.369 | 0.978 | 0.999 | 0.637 | ||||
| IPSL-CM5A-LR | [-] | 247. | 246. | 264. | -9.78 | 19.3 | 0.272 | 0.232 | 0.199 | 0.981 | 0.983 | 0.519 | ||||
| IPSL-CM6A-LR | [-] | 259. | 259. | 264. | 3.93 | 15.4 | 0.361 | 0.458 | 0.351 | 0.975 | 0.985 | 0.624 | ||||
| MeanCMIP5 | [-] | 261. | 261. | 265. | 305. | -3.06 | 11.0 | 0.203 | 0.642 | 0.500 | 0.986 | 0.998 | 0.725 | |||
| MeanCMIP6 | [-] | 261. | 261. | 264. | 2.00 | 10.5 | 0.185 | 0.517 | 0.538 | 0.988 | 1.00 | 0.716 | ||||
| MIROC-ESM | [-] | 264. | 264. | 264. | 7.22 | 17.2 | 0.257 | 0.326 | 0.295 | 0.983 | 0.990 | 0.578 | ||||
| MIROC-ESM2L | [-] | 261. | 261. | 264. | -0.123 | 15.5 | 0.234 | 0.356 | 0.404 | 0.984 | 0.993 | 0.628 | ||||
| MPI-ESM-LR | [-] | 266. | 263. | 264. | 5.68 | 13.8 | 0.310 | 0.327 | 0.403 | 0.978 | 1.00 | 0.622 | ||||
| MPI-ESM1.2-HR | [-] | 265. | 265. | 264. | 7.06 | 15.6 | 0.277 | 0.264 | 0.375 | 0.981 | 0.988 | 0.597 | ||||
| NorESM1-ME | [-] | 251. | 250. | 264. | -9.21 | 15.8 | 0.272 | 0.354 | 0.303 | 0.981 | 0.989 | 0.586 | ||||
| NorESM2-LM | [-] | 267. | 266. | 264. | 7.59 | 16.3 | 0.327 | 0.289 | 0.281 | 0.978 | 0.993 | 0.564 | ||||
| UK-HadGEM2-ES | [-] | 253. | 254. | 265. | -5.90 | 13.4 | 0.294 | 0.497 | 0.478 | 0.979 | 0.991 | 0.685 | ||||
| UKESM1-0-LL | [-] | 251. | 251. | 264. | -6.06 | 13.5 | 0.331 | 0.443 | 0.429 | 0.977 | 0.968 | 0.649 |
Download Data |
Period Mean (original grids) [W m-2] |
Model Period Mean (intersection) [W m-2] |
Benchmark Period Mean (intersection) [W m-2] |
Model Period Mean (complement) [W m-2] |
Benchmark Period Mean (complement) [W m-2] |
Bias [W m-2] |
RMSE [W m-2] |
Phase Shift [months] |
Bias Score [1] |
RMSE Score [1] |
Seasonal Cycle Score [1] |
Spatial Distribution Score [1] |
Overall Score [1] |
|||
|---|---|---|---|---|---|---|---|---|---|---|---|---|---|---|---|---|
| Benchmark | [-] | 414. | ||||||||||||||
| bcc-csm1-1 | [-] | 402. | 403. | 414. | -11.1 | 18.3 | 2.99 | 0.319 | 0.498 | 0.502 | 0.999 | 0.563 | ||||
| BCC-CSM2-MR | [-] | 404. | 404. | 414. | -9.04 | 14.9 | 3.22 | 0.408 | 0.517 | 0.461 | 0.997 | 0.580 | ||||
| CanESM2 | [-] | 404. | 406. | 414. | -7.61 | 20.0 | 2.91 | 0.348 | 0.306 | 0.519 | 0.919 | 0.480 | ||||
| CanESM5 | [-] | 407. | 408. | 414. | -4.96 | 19.8 | 2.52 | 0.349 | 0.309 | 0.611 | 0.916 | 0.499 | ||||
| CESM1-BGC | [-] | 404. | 404. | 414. | -9.68 | 17.1 | 2.90 | 0.330 | 0.387 | 0.532 | 0.998 | 0.527 | ||||
| CESM2 | [-] | 411. | 411. | 414. | -2.22 | 16.9 | 2.93 | 0.309 | 0.353 | 0.515 | 0.977 | 0.501 | ||||
| GFDL-ESM2G | [-] | 396. | 396. | 414. | -17.4 | 23.6 | 2.30 | 0.174 | 0.343 | 0.641 | 0.983 | 0.497 | ||||
| GFDL-ESM4 | [-] | 405. | 405. | 414. | -8.79 | 15.8 | 2.03 | 0.308 | 0.489 | 0.688 | 0.968 | 0.588 | ||||
| IPSL-CM5A-LR | [-] | 384. | 383. | 414. | -29.9 | 34.2 | 3.29 | 0.0213 | 0.194 | 0.446 | 0.999 | 0.371 | ||||
| IPSL-CM6A-LR | [-] | 403. | 403. | 414. | -10.2 | 17.2 | 3.65 | 0.291 | 0.482 | 0.379 | 0.953 | 0.518 | ||||
| MeanCMIP5 | [-] | 398. | 398. | 414. | -15.2 | 20.0 | 2.93 | 0.208 | 0.439 | 0.511 | 0.981 | 0.516 | ||||
| MeanCMIP6 | [-] | 407. | 407. | 414. | -5.83 | 14.3 | 3.14 | 0.393 | 0.530 | 0.478 | 0.969 | 0.580 | ||||
| MIROC-ESM | [-] | 392. | 393. | 414. | -20.7 | 25.4 | 2.33 | 0.122 | 0.448 | 0.636 | 0.999 | 0.531 | ||||
| MIROC-ESM2L | [-] | 414. | 415. | 414. | 1.66 | 17.1 | 2.94 | 0.338 | 0.565 | 0.523 | 0.999 | 0.598 | ||||
| MPI-ESM-LR | [-] | 403. | 403. | 414. | -10.2 | 16.7 | 1.74 | 0.295 | 0.531 | 0.750 | 0.994 | 0.620 | ||||
| MPI-ESM1.2-HR | [-] | 406. | 406. | 414. | -6.72 | 13.3 | 2.50 | 0.325 | 0.639 | 0.591 | 0.985 | 0.636 | ||||
| NorESM1-ME | [-] | 396. | 396. | 414. | -17.4 | 24.3 | 2.66 | 0.207 | 0.296 | 0.581 | 0.999 | 0.476 | ||||
| NorESM2-LM | [-] | 409. | 408. | 414. | -4.67 | 18.7 | 3.07 | 0.290 | 0.357 | 0.481 | 0.973 | 0.492 | ||||
| UK-HadGEM2-ES | [-] | 401. | 401. | 414. | -12.1 | 16.1 | 2.68 | 0.222 | 0.579 | 0.565 | 0.920 | 0.573 | ||||
| UKESM1-0-LL | [-] | 406. | 406. | 414. | -7.62 | 14.0 | 2.17 | 0.401 | 0.548 | 0.670 | 0.989 | 0.631 |
Temporally integrated period mean