Mean State
Download Data |
Period Mean (original grids) [watt/m2] |
Model Period Mean (intersection) [watt/m2] |
Benchmark Period Mean (intersection) [watt/m2] |
Model Period Mean (complement) [watt/m2] |
Benchmark Period Mean (complement) [watt/m2] |
Bias [watt/m2] |
RMSE [watt/m2] |
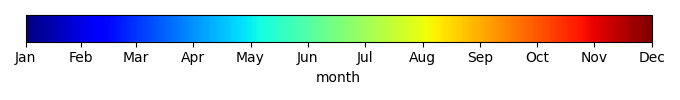
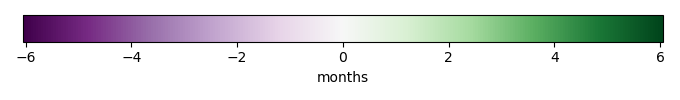
Phase Shift [months] |
Bias Score [1] |
RMSE Score [1] |
Seasonal Cycle Score [1] |
Spatial Distribution Score [1] |
Overall Score [1] |
|||
|---|---|---|---|---|---|---|---|---|---|---|---|---|---|---|---|---|
| Benchmark | [-] | 71.0 | ||||||||||||||
| bcc-csm1-1 | [-] | 65.1 | 63.5 | 71.0 | 91.7 | -6.15 | 21.5 | 2.00 | 0.466 | 0.506 | 0.690 | 0.945 | 0.622 | |||
| BCC-CSM2-MR | [-] | 71.3 | 68.8 | 71.0 | 102. | -1.32 | 22.0 | 1.97 | 0.443 | 0.512 | 0.697 | 0.857 | 0.604 | |||
| CanESM2 | [-] | 70.8 | 72.6 | 71.0 | 44.0 | 2.15 | 23.4 | 2.20 | 0.482 | 0.423 | 0.657 | 0.909 | 0.579 | |||
| CanESM5 | [-] | 81.3 | 80.3 | 71.0 | 96.9 | 9.72 | 28.9 | 2.40 | 0.313 | 0.358 | 0.624 | 0.796 | 0.490 | |||
| CESM1-BGC | [-] | 83.4 | 83.3 | 71.0 | 97.6 | 12.8 | 25.0 | 2.27 | 0.411 | 0.405 | 0.653 | 0.948 | 0.564 | |||
| CESM2 | [-] | 67.2 | 66.8 | 71.0 | 88.6 | -3.36 | 21.5 | 2.21 | 0.551 | 0.444 | 0.651 | 0.940 | 0.606 | |||
| GFDL-ESM2G | [-] | 79.7 | 79.6 | 71.0 | 85.5 | 9.24 | 28.7 | 2.24 | 0.380 | 0.319 | 0.657 | 0.904 | 0.516 | |||
| GFDL-ESM4 | [-] | 97.8 | 80.1 | 71.0 | 122. | 9.18 | 23.2 | 2.54 | 0.493 | 0.399 | 0.592 | 0.978 | 0.572 | |||
| IPSL-CM5A-LR | [-] | 70.4 | 66.8 | 71.0 | 88.6 | -2.93 | 24.4 | 2.10 | 0.392 | 0.533 | 0.669 | 0.721 | 0.569 | |||
| IPSL-CM6A-LR | [-] | 74.3 | 75.4 | 71.0 | 86.4 | 5.29 | 21.0 | 1.90 | 0.532 | 0.487 | 0.706 | 0.956 | 0.634 | |||
| MeanCMIP5 | [-] | 95.1 | 76.2 | 71.1 | 120. | 70.1 | 5.10 | 17.2 | 1.92 | 0.553 | 0.587 | 0.697 | 0.946 | 0.674 | ||
| MeanCMIP6 | [-] | 74.2 | 73.3 | 71.0 | 97.0 | 2.91 | 16.8 | 2.02 | 0.560 | 0.610 | 0.681 | 0.931 | 0.678 | |||
| MIROC-ESM | [-] | 84.8 | 85.3 | 71.0 | 65.4 | 15.2 | 28.4 | 1.99 | 0.304 | 0.411 | 0.692 | 0.868 | 0.537 | |||
| MIROC-ESM2L | [-] | 96.3 | 96.2 | 71.0 | 92.9 | 25.1 | 34.7 | 2.20 | 0.191 | 0.434 | 0.654 | 0.801 | 0.503 | |||
| MPI-ESM-LR | [-] | 68.9 | 71.7 | 71.0 | 51.4 | 2.25 | 33.6 | 2.23 | 0.334 | 0.274 | 0.642 | 0.710 | 0.447 | |||
| MPI-ESM1.2-HR | [-] | 67.4 | 67.6 | 71.0 | 53.4 | -2.47 | 31.4 | 2.30 | 0.293 | 0.366 | 0.627 | 0.666 | 0.464 | |||
| NorESM1-ME | [-] | 89.0 | 86.1 | 71.0 | 94.9 | 15.5 | 27.3 | 2.29 | 0.344 | 0.388 | 0.643 | 0.932 | 0.539 | |||
| NorESM2-LM | [-] | 61.2 | 58.5 | 71.0 | 82.7 | -11.3 | 24.3 | 2.36 | 0.372 | 0.466 | 0.626 | 0.940 | 0.574 | |||
| UK-HadGEM2-ES | [-] | 70.2 | 71.2 | 71.0 | 78.4 | 0.989 | 22.8 | 2.58 | 0.450 | 0.481 | 0.575 | 0.825 | 0.562 | |||
| UKESM1-0-LL | [-] | 67.3 | 65.7 | 71.0 | 87.2 | -4.56 | 24.4 | 2.33 | 0.341 | 0.501 | 0.629 | 0.759 | 0.546 |
Download Data |
Period Mean (original grids) [watt/m2] |
Model Period Mean (intersection) [watt/m2] |
Benchmark Period Mean (intersection) [watt/m2] |
Model Period Mean (complement) [watt/m2] |
Benchmark Period Mean (complement) [watt/m2] |
Bias [watt/m2] |
RMSE [watt/m2] |
Phase Shift [months] |
Bias Score [1] |
RMSE Score [1] |
Seasonal Cycle Score [1] |
Spatial Distribution Score [1] |
Overall Score [1] |
|||
|---|---|---|---|---|---|---|---|---|---|---|---|---|---|---|---|---|
| Benchmark | [-] | 109. | ||||||||||||||
| bcc-csm1-1 | [-] | 109. | 103. | 109. | 118. | 1.04 | 20.8 | 2.81 | 0.483 | 0.602 | 0.549 | 0.798 | 0.607 | |||
| BCC-CSM2-MR | [-] | 122. | 121. | 109. | 127. | 13.8 | 19.7 | 2.69 | 0.495 | 0.683 | 0.563 | 0.966 | 0.678 | |||
| CanESM2 | [-] | 103. | 103. | 109. | 104. | 1.07 | 20.3 | 2.68 | 0.534 | 0.619 | 0.565 | 0.651 | 0.597 | |||
| CanESM5 | [-] | 120. | 118. | 109. | 122. | 11.0 | 17.6 | 2.61 | 0.534 | 0.687 | 0.581 | 0.995 | 0.697 | |||
| CESM1-BGC | [-] | 113. | 112. | 109. | 119. | 4.96 | 14.8 | 2.34 | 0.641 | 0.701 | 0.635 | 0.993 | 0.734 | |||
| CESM2 | [-] | 98.8 | 96.4 | 109. | 108. | -8.25 | 18.9 | 2.62 | 0.455 | 0.706 | 0.577 | 0.928 | 0.675 | |||
| GFDL-ESM2G | [-] | 116. | 112. | 109. | 122. | 7.51 | 17.4 | 2.56 | 0.597 | 0.660 | 0.591 | 0.945 | 0.690 | |||
| GFDL-ESM4 | [-] | 125. | 111. | 109. | 129. | 1.78 | 14.7 | 2.89 | 0.692 | 0.680 | 0.525 | 0.940 | 0.703 | |||
| IPSL-CM5A-LR | [-] | 98.5 | 97.5 | 109. | 99.0 | -9.70 | 18.0 | 2.13 | 0.475 | 0.729 | 0.658 | 0.990 | 0.716 | |||
| IPSL-CM6A-LR | [-] | 95.7 | 91.7 | 109. | 105. | -12.2 | 22.4 | 2.45 | 0.407 | 0.705 | 0.605 | 0.665 | 0.617 | |||
| MeanCMIP5 | [-] | 127. | 114. | 109. | 131. | 4.94 | 13.4 | 2.50 | 0.665 | 0.745 | 0.601 | 0.972 | 0.746 | |||
| MeanCMIP6 | [-] | 115. | 113. | 109. | 120. | 4.83 | 12.2 | 2.26 | 0.704 | 0.758 | 0.638 | 0.869 | 0.745 | |||
| MIROC-ESM | [-] | 123. | 122. | 109. | 126. | 13.0 | 20.3 | 3.41 | 0.483 | 0.668 | 0.421 | 0.996 | 0.647 | |||
| MIROC-ESM2L | [-] | 130. | 132. | 109. | 127. | 20.3 | 25.8 | 2.61 | 0.304 | 0.690 | 0.580 | 0.977 | 0.648 | |||
| MPI-ESM-LR | [-] | 113. | 113. | 109. | 114. | 13.7 | 24.8 | 2.73 | 0.454 | 0.580 | 0.562 | 0.646 | 0.564 | |||
| MPI-ESM1.2-HR | [-] | 120. | 122. | 109. | 107. | 12.0 | 32.1 | 2.27 | 0.274 | 0.536 | 0.652 | 0.394 | 0.478 | |||
| NorESM1-ME | [-] | 111. | 110. | 109. | 113. | 1.63 | 14.4 | 2.45 | 0.670 | 0.695 | 0.605 | 0.863 | 0.706 | |||
| NorESM2-LM | [-] | 108. | 105. | 109. | 116. | -0.255 | 15.8 | 2.64 | 0.586 | 0.714 | 0.573 | 0.993 | 0.716 | |||
| UK-HadGEM2-ES | [-] | 117. | 116. | 109. | 116. | 10.3 | 21.0 | 2.23 | 0.531 | 0.610 | 0.661 | 0.780 | 0.639 | |||
| UKESM1-0-LL | [-] | 113. | 112. | 109. | 117. | 4.55 | 14.4 | 2.35 | 0.688 | 0.706 | 0.630 | 0.995 | 0.745 |
Download Data |
Period Mean (original grids) [watt/m2] |
Model Period Mean (intersection) [watt/m2] |
Benchmark Period Mean (intersection) [watt/m2] |
Model Period Mean (complement) [watt/m2] |
Benchmark Period Mean (complement) [watt/m2] |
Bias [watt/m2] |
RMSE [watt/m2] |
Phase Shift [months] |
Bias Score [1] |
RMSE Score [1] |
Seasonal Cycle Score [1] |
Spatial Distribution Score [1] |
Overall Score [1] |
|||
|---|---|---|---|---|---|---|---|---|---|---|---|---|---|---|---|---|
| Benchmark | [-] | 48.9 | ||||||||||||||
| bcc-csm1-1 | [-] | 37.5 | 43.1 | 48.9 | 18.5 | -2.91 | 22.5 | 1.44 | 0.471 | 0.379 | 0.795 | 0.962 | 0.597 | |||
| BCC-CSM2-MR | [-] | 41.2 | 49.1 | 48.9 | 15.3 | 1.88 | 18.2 | 1.20 | 0.540 | 0.469 | 0.842 | 0.955 | 0.655 | |||
| CanESM2 | [-] | 34.7 | 41.8 | 48.9 | 12.7 | -3.81 | 22.8 | 1.40 | 0.440 | 0.383 | 0.811 | 0.940 | 0.591 | |||
| CanESM5 | [-] | 43.9 | 51.8 | 48.9 | 17.8 | 5.72 | 23.9 | 1.40 | 0.398 | 0.369 | 0.807 | 0.917 | 0.572 | |||
| CESM1-BGC | [-] | 46.6 | 56.1 | 48.9 | 15.1 | 8.78 | 20.8 | 1.15 | 0.391 | 0.451 | 0.848 | 0.930 | 0.614 | |||
| CESM2 | [-] | 38.1 | 45.5 | 48.9 | 13.8 | -1.55 | 16.9 | 1.17 | 0.534 | 0.498 | 0.844 | 0.974 | 0.669 | |||
| GFDL-ESM2G | [-] | 43.9 | 51.6 | 48.9 | 18.8 | 4.88 | 23.3 | 1.27 | 0.397 | 0.379 | 0.826 | 0.963 | 0.589 | |||
| GFDL-ESM4 | [-] | 49.8 | 55.1 | 48.9 | 37.1 | 6.21 | 18.6 | 1.20 | 0.417 | 0.504 | 0.837 | 0.978 | 0.648 | |||
| IPSL-CM5A-LR | [-] | 37.6 | 44.5 | 48.9 | 16.1 | -1.83 | 21.2 | 1.29 | 0.446 | 0.426 | 0.818 | 0.958 | 0.615 | |||
| IPSL-CM6A-LR | [-] | 43.5 | 52.4 | 48.9 | 14.4 | 5.65 | 17.9 | 1.11 | 0.491 | 0.530 | 0.853 | 0.960 | 0.673 | |||
| MeanCMIP5 | [-] | 47.8 | 52.2 | 49.0 | 37.7 | 49.4 | 3.28 | 15.9 | 1.10 | 0.542 | 0.557 | 0.850 | 0.980 | 0.697 | ||
| MeanCMIP6 | [-] | 43.8 | 52.0 | 48.9 | 17.5 | 4.55 | 14.5 | 0.975 | 0.554 | 0.603 | 0.873 | 0.974 | 0.722 | |||
| MIROC-ESM | [-] | 44.9 | 54.1 | 48.9 | 15.1 | 8.82 | 24.9 | 1.31 | 0.380 | 0.417 | 0.819 | 0.905 | 0.588 | |||
| MIROC-ESM2L | [-] | 55.8 | 65.8 | 48.9 | 25.3 | 18.3 | 27.6 | 1.32 | 0.221 | 0.462 | 0.821 | 0.864 | 0.566 | |||
| MPI-ESM-LR | [-] | 42.4 | 48.9 | 48.9 | 9.06 | 3.32 | 22.1 | 1.21 | 0.415 | 0.453 | 0.833 | 0.930 | 0.617 | |||
| MPI-ESM1.2-HR | [-] | 41.3 | 51.2 | 48.9 | 5.62 | 3.90 | 22.9 | 1.15 | 0.321 | 0.476 | 0.841 | 0.904 | 0.604 | |||
| NorESM1-ME | [-] | 45.9 | 54.2 | 48.9 | 18.5 | 7.06 | 22.9 | 1.24 | 0.377 | 0.405 | 0.833 | 0.914 | 0.587 | |||
| NorESM2-LM | [-] | 38.8 | 45.4 | 48.9 | 16.7 | -1.32 | 18.4 | 1.19 | 0.469 | 0.473 | 0.843 | 0.961 | 0.644 | |||
| UK-HadGEM2-ES | [-] | 44.0 | 52.9 | 49.0 | 14.4 | 5.58 | 19.4 | 1.20 | 0.383 | 0.522 | 0.834 | 0.953 | 0.643 | |||
| UKESM1-0-LL | [-] | 41.3 | 49.5 | 48.9 | 14.3 | 2.64 | 18.6 | 1.17 | 0.491 | 0.505 | 0.843 | 0.930 | 0.655 |
Download Data |
Period Mean (original grids) [watt/m2] |
Model Period Mean (intersection) [watt/m2] |
Benchmark Period Mean (intersection) [watt/m2] |
Model Period Mean (complement) [watt/m2] |
Benchmark Period Mean (complement) [watt/m2] |
Bias [watt/m2] |
RMSE [watt/m2] |
Phase Shift [months] |
Bias Score [1] |
RMSE Score [1] |
Seasonal Cycle Score [1] |
Spatial Distribution Score [1] |
Overall Score [1] |
|||
|---|---|---|---|---|---|---|---|---|---|---|---|---|---|---|---|---|
| Benchmark | [-] | 25.2 | ||||||||||||||
| bcc-csm1-1 | [-] | 21.7 | 23.7 | 25.2 | 11.9 | -1.64 | 15.6 | 0.746 | 0.645 | 0.240 | 0.911 | 0.975 | 0.602 | |||
| BCC-CSM2-MR | [-] | 21.8 | 24.1 | 25.2 | 9.37 | -1.18 | 12.8 | 0.656 | 0.638 | 0.350 | 0.932 | 0.927 | 0.639 | |||
| CanESM2 | [-] | 19.6 | 21.6 | 25.2 | 10.0 | -3.27 | 15.7 | 0.792 | 0.516 | 0.261 | 0.920 | 0.955 | 0.583 | |||
| CanESM5 | [-] | 23.8 | 26.0 | 25.2 | 11.8 | 0.692 | 14.3 | 0.801 | 0.610 | 0.293 | 0.910 | 0.881 | 0.597 | |||
| CESM1-BGC | [-] | 22.4 | 24.1 | 25.2 | 10.2 | -0.884 | 13.1 | 0.601 | 0.480 | 0.397 | 0.940 | 0.761 | 0.595 | |||
| CESM2 | [-] | 20.9 | 22.6 | 25.2 | 8.71 | -2.34 | 12.3 | 0.658 | 0.599 | 0.401 | 0.932 | 0.917 | 0.650 | |||
| GFDL-ESM2G | [-] | 27.0 | 29.9 | 25.2 | 12.5 | 4.26 | 13.3 | 0.626 | 0.427 | 0.464 | 0.934 | 0.916 | 0.641 | |||
| GFDL-ESM4 | [-] | 31.1 | 32.4 | 25.2 | 29.8 | 7.20 | 12.6 | 0.444 | 0.314 | 0.558 | 0.960 | 0.947 | 0.668 | |||
| IPSL-CM5A-LR | [-] | 27.7 | 29.7 | 25.2 | 15.4 | 4.49 | 14.5 | 0.689 | 0.551 | 0.303 | 0.927 | 0.966 | 0.610 | |||
| IPSL-CM6A-LR | [-] | 26.1 | 28.3 | 25.2 | 11.3 | 3.15 | 9.89 | 0.617 | 0.585 | 0.568 | 0.938 | 0.939 | 0.720 | |||
| MeanCMIP5 | [-] | 27.1 | 26.5 | 25.3 | 27.7 | 37.9 | 1.25 | 10.3 | 0.555 | 0.697 | 0.482 | 0.944 | 0.955 | 0.712 | ||
| MeanCMIP6 | [-] | 25.5 | 27.6 | 25.2 | 12.1 | 2.25 | 9.87 | 0.536 | 0.669 | 0.513 | 0.949 | 0.938 | 0.717 | |||
| MIROC-ESM | [-] | 23.5 | 26.0 | 25.2 | 9.85 | 1.21 | 13.1 | 0.702 | 0.573 | 0.408 | 0.917 | 0.846 | 0.631 | |||
| MIROC-ESM2L | [-] | 32.5 | 35.4 | 25.2 | 19.8 | 9.90 | 16.9 | 0.725 | 0.294 | 0.402 | 0.924 | 0.666 | 0.538 | |||
| MPI-ESM-LR | [-] | 28.7 | 28.9 | 25.2 | 9.40 | 3.59 | 11.1 | 0.607 | 0.547 | 0.530 | 0.937 | 0.873 | 0.683 | |||
| MPI-ESM1.2-HR | [-] | 29.7 | 32.1 | 25.2 | 7.33 | 6.57 | 12.3 | 0.597 | 0.391 | 0.564 | 0.941 | 0.783 | 0.648 | |||
| NorESM1-ME | [-] | 20.3 | 21.2 | 25.2 | 10.6 | -3.86 | 14.9 | 0.730 | 0.470 | 0.330 | 0.921 | 0.792 | 0.568 | |||
| NorESM2-LM | [-] | 20.3 | 21.5 | 25.2 | 9.91 | -3.75 | 14.0 | 0.706 | 0.533 | 0.321 | 0.925 | 0.921 | 0.604 | |||
| UK-HadGEM2-ES | [-] | 30.5 | 33.2 | 25.3 | 14.1 | 7.34 | 12.7 | 0.554 | 0.301 | 0.545 | 0.940 | 0.903 | 0.647 | |||
| UKESM1-0-LL | [-] | 23.4 | 25.2 | 25.2 | 10.5 | 0.0111 | 11.7 | 0.612 | 0.700 | 0.397 | 0.939 | 0.958 | 0.678 |
Download Data |
Period Mean (original grids) [watt/m2] |
Model Period Mean (intersection) [watt/m2] |
Benchmark Period Mean (intersection) [watt/m2] |
Model Period Mean (complement) [watt/m2] |
Benchmark Period Mean (complement) [watt/m2] |
Bias [watt/m2] |
RMSE [watt/m2] |
Phase Shift [months] |
Bias Score [1] |
RMSE Score [1] |
Seasonal Cycle Score [1] |
Spatial Distribution Score [1] |
Overall Score [1] |
|||
|---|---|---|---|---|---|---|---|---|---|---|---|---|---|---|---|---|
| Benchmark | [-] | 99.9 | ||||||||||||||
| bcc-csm1-1 | [-] | 69.0 | 68.6 | 99.9 | 75.9 | -30.7 | 41.1 | 2.13 | 0.163 | 0.389 | 0.681 | 0.918 | 0.508 | |||
| BCC-CSM2-MR | [-] | 101. | 101. | 99.9 | 107. | 1.35 | 23.7 | 2.05 | 0.574 | 0.478 | 0.705 | 0.991 | 0.645 | |||
| CanESM2 | [-] | 65.1 | 65.0 | 99.9 | 52.1 | -34.4 | 50.2 | 3.18 | 0.170 | 0.184 | 0.472 | 0.837 | 0.369 | |||
| CanESM5 | [-] | 87.8 | 87.7 | 99.9 | 93.7 | -11.8 | 42.8 | 2.11 | 0.288 | 0.209 | 0.682 | 0.782 | 0.434 | |||
| CESM1-BGC | [-] | 104. | 105. | 99.9 | 95.5 | 4.65 | 24.6 | 1.52 | 0.486 | 0.503 | 0.788 | 0.932 | 0.643 | |||
| CESM2 | [-] | 95.0 | 95.0 | 99.9 | 96.7 | -4.76 | 16.5 | 2.14 | 0.611 | 0.674 | 0.671 | 0.950 | 0.716 | |||
| GFDL-ESM2G | [-] | 79.6 | 79.2 | 99.9 | 88.1 | -20.4 | 45.2 | 2.67 | 0.261 | 0.0838 | 0.575 | 0.984 | 0.398 | |||
| GFDL-ESM4 | [-] | 101. | 100. | 99.9 | 107. | 0.354 | 29.1 | 2.33 | 0.435 | 0.410 | 0.643 | 0.918 | 0.563 | |||
| IPSL-CM5A-LR | [-] | 89.7 | 89.4 | 99.9 | 86.8 | -10.5 | 32.3 | 2.55 | 0.384 | 0.441 | 0.585 | 0.683 | 0.507 | |||
| IPSL-CM6A-LR | [-] | 106. | 106. | 99.9 | 96.4 | 5.99 | 18.5 | 1.24 | 0.604 | 0.611 | 0.828 | 0.990 | 0.729 | |||
| MeanCMIP5 | [-] | 89.3 | 88.7 | 99.9 | 97.3 | -11.3 | 25.1 | 2.68 | 0.469 | 0.526 | 0.565 | 0.988 | 0.615 | |||
| MeanCMIP6 | [-] | 105. | 105. | 99.9 | 104. | 4.50 | 17.1 | 1.64 | 0.580 | 0.689 | 0.769 | 0.925 | 0.730 | |||
| MIROC-ESM | [-] | 92.5 | 93.4 | 99.9 | 70.0 | -6.57 | 33.0 | 2.63 | 0.421 | 0.382 | 0.579 | 0.795 | 0.512 | |||
| MIROC-ESM2L | [-] | 132. | 132. | 99.9 | 116. | 31.6 | 38.0 | 2.46 | 0.110 | 0.621 | 0.613 | 0.957 | 0.584 | |||
| MPI-ESM-LR | [-] | 84.6 | 85.5 | 99.9 | 46.3 | -14.0 | 37.5 | 2.87 | 0.346 | 0.322 | 0.524 | 0.716 | 0.446 | |||
| MPI-ESM1.2-HR | [-] | 112. | 113. | 99.9 | 70.5 | 12.5 | 38.6 | 2.17 | 0.165 | 0.515 | 0.657 | 0.563 | 0.483 | |||
| NorESM1-ME | [-] | 102. | 102. | 99.9 | 92.9 | 1.63 | 25.5 | 1.69 | 0.465 | 0.477 | 0.746 | 0.914 | 0.616 | |||
| NorESM2-LM | [-] | 96.2 | 95.5 | 99.9 | 104. | -3.96 | 15.8 | 1.59 | 0.580 | 0.710 | 0.782 | 0.719 | 0.700 | |||
| UK-HadGEM2-ES | [-] | 110. | 110. | 99.9 | 88.1 | 10.1 | 23.4 | 1.69 | 0.349 | 0.652 | 0.745 | 0.946 | 0.669 | |||
| UKESM1-0-LL | [-] | 109. | 109. | 99.9 | 107. | 9.29 | 23.9 | 2.33 | 0.397 | 0.589 | 0.626 | 0.985 | 0.637 |
Temporally integrated period mean