Mean State
Download Data |
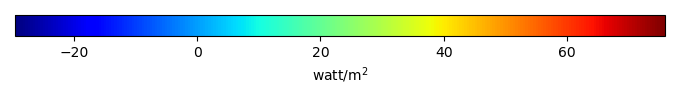
Period Mean (original grids) [watt/m2] |
Model Period Mean (intersection) [watt/m2] |
Benchmark Period Mean (intersection) [watt/m2] |
Model Period Mean (complement) [watt/m2] |
Benchmark Period Mean (complement) [watt/m2] |
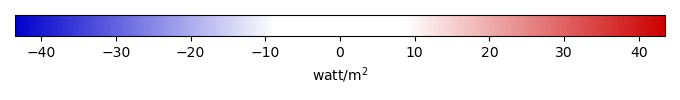
Bias [watt/m2] |
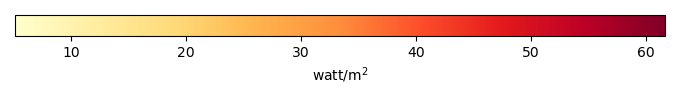
RMSE [watt/m2] |
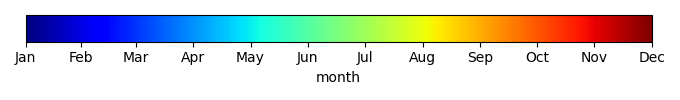
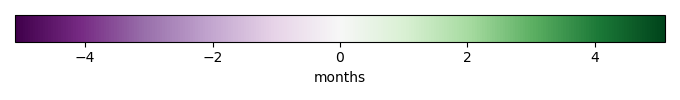
Phase Shift [months] |
Bias Score [1] |
RMSE Score [1] |
Seasonal Cycle Score [1] |
Spatial Distribution Score [1] |
Overall Score [1] |
|||
|---|---|---|---|---|---|---|---|---|---|---|---|---|---|---|---|---|
| Benchmark | [-] | 51.6 | ||||||||||||||
| bcc-csm1-1 | [-] | 47.8 | 48.4 | 51.6 | 36.1 | -3.74 | 20.3 | 1.17 | 0.371 | 0.530 | 0.859 | 0.502 | 0.558 | |||
| BCC-CSM2-MR | [-] | 57.1 | 58.3 | 51.6 | 34.2 | 6.01 | 18.2 | 1.16 | 0.443 | 0.541 | 0.857 | 0.568 | 0.590 | |||
| CanESM2 | [-] | 49.9 | 48.6 | 51.6 | 67.8 | -3.66 | 21.2 | 1.28 | 0.426 | 0.455 | 0.837 | 0.580 | 0.550 | |||
| CanESM5 | [-] | 42.5 | 43.0 | 51.6 | 34.4 | -9.08 | 22.7 | 1.66 | 0.283 | 0.447 | 0.776 | 0.589 | 0.509 | |||
| CESM1-BGC | [-] | 39.0 | 39.0 | 51.6 | 33.9 | -13.0 | 22.6 | 1.39 | 0.247 | 0.485 | 0.820 | 0.633 | 0.534 | |||
| CESM2 | [-] | 50.5 | 50.6 | 51.6 | 42.4 | -1.46 | 18.9 | 1.69 | 0.449 | 0.495 | 0.774 | 0.608 | 0.564 | |||
| GFDL-ESM2G | [-] | 40.0 | 40.3 | 51.6 | 33.5 | -11.8 | 24.5 | 1.19 | 0.198 | 0.430 | 0.859 | 0.576 | 0.499 | |||
| GFDL-ESM4 | [-] | 26.3 | 37.2 | 51.6 | 11.8 | -14.5 | 22.1 | 1.14 | 0.176 | 0.543 | 0.872 | 0.706 | 0.568 | |||
| IPSL-CM5A-LR | [-] | 71.3 | 72.8 | 51.6 | 55.3 | 20.1 | 29.2 | 1.98 | 0.247 | 0.372 | 0.727 | 0.584 | 0.460 | |||
| IPSL-CM6A-LR | [-] | 50.1 | 50.3 | 51.6 | 38.3 | -2.09 | 15.8 | 1.27 | 0.568 | 0.535 | 0.839 | 0.743 | 0.644 | |||
| MeanCMIP5 | [-] | 33.2 | 48.1 | 51.6 | 13.4 | 48.0 | -3.47 | 17.2 | 1.08 | 0.407 | 0.584 | 0.886 | 0.621 | 0.616 | ||
| MeanCMIP6 | [-] | 48.5 | 49.1 | 51.6 | 30.3 | -2.89 | 16.6 | 1.15 | 0.446 | 0.591 | 0.869 | 0.658 | 0.631 | |||
| MIROC-ESM | [-] | 51.6 | 51.0 | 51.6 | 69.1 | -2.27 | 24.5 | 1.67 | 0.330 | 0.416 | 0.767 | 0.444 | 0.475 | |||
| MIROC-ESM2L | [-] | 37.3 | 37.5 | 51.6 | 35.6 | -14.4 | 28.4 | 2.18 | 0.215 | 0.450 | 0.669 | 0.427 | 0.442 | |||
| MPI-ESM-LR | [-] | 54.1 | 52.3 | 51.6 | 74.7 | -1.04 | 34.6 | 2.14 | 0.185 | 0.286 | 0.703 | 0.258 | 0.344 | |||
| MPI-ESM1.2-HR | [-] | 64.1 | 64.0 | 51.6 | 74.0 | 11.5 | 31.8 | 1.83 | 0.255 | 0.302 | 0.751 | 0.333 | 0.388 | |||
| NorESM1-ME | [-] | 35.1 | 36.4 | 51.6 | 29.3 | -15.7 | 24.6 | 1.64 | 0.239 | 0.442 | 0.777 | 0.627 | 0.505 | |||
| NorESM2-LM | [-] | 52.8 | 53.8 | 51.6 | 39.4 | 1.38 | 18.5 | 1.76 | 0.523 | 0.471 | 0.761 | 0.707 | 0.586 | |||
| UK-HadGEM2-ES | [-] | 52.1 | 52.4 | 51.6 | 38.1 | -0.0225 | 19.2 | 1.25 | 0.428 | 0.496 | 0.838 | 0.619 | 0.575 | |||
| UKESM1-0-LL | [-] | 48.3 | 49.1 | 51.6 | 30.2 | -3.15 | 18.9 | 1.34 | 0.373 | 0.531 | 0.833 | 0.620 | 0.578 |
Download Data |
Period Mean (original grids) [watt/m2] |
Model Period Mean (intersection) [watt/m2] |
Benchmark Period Mean (intersection) [watt/m2] |
Model Period Mean (complement) [watt/m2] |
Benchmark Period Mean (complement) [watt/m2] |
Bias [watt/m2] |
RMSE [watt/m2] |
Phase Shift [months] |
Bias Score [1] |
RMSE Score [1] |
Seasonal Cycle Score [1] |
Spatial Distribution Score [1] |
Overall Score [1] |
|||
|---|---|---|---|---|---|---|---|---|---|---|---|---|---|---|---|---|
| Benchmark | [-] | 36.2 | ||||||||||||||
| bcc-csm1-1 | [-] | 20.1 | 21.8 | 36.2 | 17.4 | -16.7 | 23.3 | 1.46 | 0.255 | 0.554 | 0.800 | 0.890 | 0.611 | |||
| BCC-CSM2-MR | [-] | 22.4 | 24.0 | 36.2 | 17.7 | -14.7 | 16.8 | 1.72 | 0.343 | 0.756 | 0.753 | 0.930 | 0.708 | |||
| CanESM2 | [-] | 32.5 | 29.6 | 36.2 | 36.5 | -11.1 | 18.4 | 2.52 | 0.368 | 0.633 | 0.588 | 0.636 | 0.572 | |||
| CanESM5 | [-] | 15.5 | 16.0 | 36.2 | 14.8 | -20.7 | 21.4 | 2.18 | 0.109 | 0.809 | 0.660 | 0.586 | 0.595 | |||
| CESM1-BGC | [-] | 11.8 | 11.4 | 36.2 | 12.9 | -24.5 | 25.2 | 1.74 | 0.0264 | 0.816 | 0.754 | 0.773 | 0.637 | |||
| CESM2 | [-] | 29.6 | 30.8 | 36.2 | 24.8 | -8.63 | 11.9 | 1.59 | 0.556 | 0.775 | 0.769 | 0.920 | 0.759 | |||
| GFDL-ESM2G | [-] | 9.94 | 10.4 | 36.2 | 9.83 | -26.3 | 27.0 | 2.20 | 0.0174 | 0.799 | 0.655 | 0.778 | 0.610 | |||
| GFDL-ESM4 | [-] | 12.4 | 15.9 | 36.2 | 11.4 | -20.3 | 21.2 | 1.77 | 0.107 | 0.801 | 0.751 | 0.838 | 0.660 | |||
| IPSL-CM5A-LR | [-] | 36.8 | 39.8 | 36.2 | 33.0 | -1.68 | 13.3 | 2.34 | 0.506 | 0.781 | 0.638 | 0.462 | 0.634 | |||
| IPSL-CM6A-LR | [-] | 19.5 | 20.7 | 36.2 | 16.9 | -17.2 | 17.9 | 2.34 | 0.232 | 0.822 | 0.629 | 0.938 | 0.689 | |||
| MeanCMIP5 | [-] | 13.7 | 18.5 | 36.3 | 12.4 | -17.8 | 18.7 | 1.47 | 0.201 | 0.819 | 0.790 | 0.726 | 0.671 | |||
| MeanCMIP6 | [-] | 19.3 | 21.0 | 36.2 | 15.3 | -16.1 | 17.1 | 1.55 | 0.262 | 0.830 | 0.783 | 0.858 | 0.713 | |||
| MIROC-ESM | [-] | 21.7 | 22.3 | 36.2 | 20.4 | -16.7 | 19.6 | 3.15 | 0.280 | 0.663 | 0.475 | 0.937 | 0.604 | |||
| MIROC-ESM2L | [-] | 4.88 | 4.74 | 36.2 | 4.92 | -31.5 | 32.8 | 2.40 | 0.0353 | 0.724 | 0.613 | 0.735 | 0.566 | |||
| MPI-ESM-LR | [-] | 19.9 | 18.9 | 36.2 | 23.2 | -19.1 | 23.7 | 3.07 | 0.148 | 0.655 | 0.497 | 0.808 | 0.552 | |||
| MPI-ESM1.2-HR | [-] | 34.8 | 32.8 | 36.2 | 48.3 | -6.79 | 24.8 | 2.34 | 0.274 | 0.557 | 0.639 | 0.239 | 0.453 | |||
| NorESM1-ME | [-] | 9.56 | 8.78 | 36.2 | 11.2 | -26.6 | 27.3 | 1.94 | 0.0135 | 0.796 | 0.718 | 0.642 | 0.593 | |||
| NorESM2-LM | [-] | 30.3 | 33.5 | 36.2 | 24.1 | -6.43 | 11.7 | 2.33 | 0.545 | 0.776 | 0.634 | 0.913 | 0.729 | |||
| UK-HadGEM2-ES | [-] | 20.1 | 21.0 | 36.3 | 19.4 | -17.6 | 21.5 | 1.91 | 0.207 | 0.701 | 0.711 | 0.783 | 0.620 | |||
| UKESM1-0-LL | [-] | 17.3 | 18.5 | 36.2 | 14.6 | -19.7 | 20.7 | 1.72 | 0.157 | 0.803 | 0.756 | 0.963 | 0.697 |
Download Data |
Period Mean (original grids) [watt/m2] |
Model Period Mean (intersection) [watt/m2] |
Benchmark Period Mean (intersection) [watt/m2] |
Model Period Mean (complement) [watt/m2] |
Benchmark Period Mean (complement) [watt/m2] |
Bias [watt/m2] |
RMSE [watt/m2] |
Phase Shift [months] |
Bias Score [1] |
RMSE Score [1] |
Seasonal Cycle Score [1] |
Spatial Distribution Score [1] |
Overall Score [1] |
|||
|---|---|---|---|---|---|---|---|---|---|---|---|---|---|---|---|---|
| Benchmark | [-] | 40.7 | ||||||||||||||
| bcc-csm1-1 | [-] | 35.1 | 40.0 | 40.7 | 20.8 | -1.99 | 23.4 | 1.25 | 0.326 | 0.345 | 0.838 | 0.779 | 0.526 | |||
| BCC-CSM2-MR | [-] | 34.0 | 39.2 | 40.7 | 16.8 | -2.32 | 22.3 | 1.27 | 0.324 | 0.374 | 0.838 | 0.724 | 0.527 | |||
| CanESM2 | [-] | 36.5 | 41.8 | 40.7 | 20.5 | -0.257 | 21.1 | 1.28 | 0.389 | 0.442 | 0.833 | 0.821 | 0.586 | |||
| CanESM5 | [-] | 27.9 | 32.6 | 40.7 | 13.4 | -8.79 | 21.3 | 1.35 | 0.307 | 0.459 | 0.821 | 0.900 | 0.589 | |||
| CESM1-BGC | [-] | 26.7 | 32.2 | 40.7 | 8.87 | -9.07 | 18.9 | 1.05 | 0.380 | 0.500 | 0.874 | 0.914 | 0.634 | |||
| CESM2 | [-] | 33.5 | 39.5 | 40.7 | 13.8 | -1.85 | 17.1 | 1.16 | 0.445 | 0.484 | 0.859 | 0.878 | 0.630 | |||
| GFDL-ESM2G | [-] | 25.6 | 30.4 | 40.7 | 10.5 | -11.1 | 23.4 | 1.08 | 0.271 | 0.388 | 0.871 | 0.889 | 0.561 | |||
| GFDL-ESM4 | [-] | 23.2 | 27.7 | 40.7 | 12.7 | -13.0 | 21.8 | 1.18 | 0.255 | 0.444 | 0.863 | 0.876 | 0.576 | |||
| IPSL-CM5A-LR | [-] | 36.8 | 44.0 | 40.7 | 15.6 | 2.38 | 24.6 | 1.36 | 0.260 | 0.432 | 0.822 | 0.635 | 0.516 | |||
| IPSL-CM6A-LR | [-] | 29.7 | 35.5 | 40.7 | 11.3 | -5.96 | 16.7 | 1.08 | 0.449 | 0.524 | 0.870 | 0.935 | 0.660 | |||
| MeanCMIP5 | [-] | 29.8 | 35.8 | 40.8 | 16.0 | 41.7 | -4.97 | 16.6 | 0.950 | 0.407 | 0.561 | 0.893 | 0.887 | 0.662 | ||
| MeanCMIP6 | [-] | 29.7 | 34.7 | 40.7 | 14.0 | -6.52 | 16.2 | 0.994 | 0.429 | 0.544 | 0.885 | 0.911 | 0.662 | |||
| MIROC-ESM | [-] | 35.4 | 40.9 | 40.7 | 17.8 | -1.76 | 24.5 | 1.39 | 0.304 | 0.371 | 0.814 | 0.758 | 0.524 | |||
| MIROC-ESM2L | [-] | 22.5 | 25.4 | 40.7 | 14.5 | -15.9 | 25.3 | 1.24 | 0.212 | 0.453 | 0.837 | 0.822 | 0.555 | |||
| MPI-ESM-LR | [-] | 35.4 | 35.9 | 40.7 | 18.3 | -6.06 | 25.9 | 1.45 | 0.232 | 0.350 | 0.806 | 0.695 | 0.486 | |||
| MPI-ESM1.2-HR | [-] | 35.7 | 41.1 | 40.7 | 16.2 | -0.466 | 24.1 | 1.26 | 0.268 | 0.392 | 0.835 | 0.681 | 0.514 | |||
| NorESM1-ME | [-] | 27.0 | 31.6 | 40.7 | 12.7 | -9.74 | 20.5 | 1.17 | 0.343 | 0.477 | 0.856 | 0.895 | 0.610 | |||
| NorESM2-LM | [-] | 34.1 | 39.6 | 40.7 | 16.8 | -2.31 | 17.9 | 1.33 | 0.437 | 0.450 | 0.829 | 0.890 | 0.611 | |||
| UK-HadGEM2-ES | [-] | 30.4 | 35.1 | 40.8 | 15.3 | -6.65 | 18.5 | 1.07 | 0.354 | 0.516 | 0.867 | 0.888 | 0.628 | |||
| UKESM1-0-LL | [-] | 28.9 | 33.4 | 40.7 | 14.5 | -8.19 | 18.4 | 1.21 | 0.366 | 0.492 | 0.852 | 0.929 | 0.626 |
Download Data |
Period Mean (original grids) [watt/m2] |
Model Period Mean (intersection) [watt/m2] |
Benchmark Period Mean (intersection) [watt/m2] |
Model Period Mean (complement) [watt/m2] |
Benchmark Period Mean (complement) [watt/m2] |
Bias [watt/m2] |
RMSE [watt/m2] |
Phase Shift [months] |
Bias Score [1] |
RMSE Score [1] |
Seasonal Cycle Score [1] |
Spatial Distribution Score [1] |
Overall Score [1] |
|||
|---|---|---|---|---|---|---|---|---|---|---|---|---|---|---|---|---|
| Benchmark | [-] | 24.9 | ||||||||||||||
| bcc-csm1-1 | [-] | 10.2 | 11.9 | 24.9 | 2.18 | -12.9 | 24.0 | 1.39 | 0.242 | 0.259 | 0.821 | 0.881 | 0.492 | |||
| BCC-CSM2-MR | [-] | 4.00 | 6.25 | 24.9 | -7.81 | -18.4 | 25.9 | 1.35 | 0.133 | 0.328 | 0.844 | 0.767 | 0.480 | |||
| CanESM2 | [-] | 13.2 | 16.5 | 24.9 | -3.56 | -8.01 | 18.1 | 1.02 | 0.418 | 0.454 | 0.885 | 0.813 | 0.605 | |||
| CanESM5 | [-] | 9.88 | 11.9 | 24.9 | -1.40 | -12.7 | 20.4 | 1.05 | 0.224 | 0.446 | 0.874 | 0.911 | 0.580 | |||
| CESM1-BGC | [-] | 9.65 | 12.4 | 24.9 | -10.3 | -12.3 | 19.6 | 0.868 | 0.331 | 0.459 | 0.907 | 0.640 | 0.559 | |||
| CESM2 | [-] | 11.5 | 13.7 | 24.9 | -4.54 | -11.0 | 20.6 | 1.02 | 0.286 | 0.363 | 0.880 | 0.856 | 0.550 | |||
| GFDL-ESM2G | [-] | 5.85 | 7.67 | 24.9 | -2.27 | -17.0 | 24.8 | 0.907 | 0.127 | 0.334 | 0.900 | 0.854 | 0.510 | |||
| GFDL-ESM4 | [-] | 10.4 | 5.97 | 24.9 | 14.7 | -18.9 | 26.7 | 1.07 | 0.105 | 0.270 | 0.886 | 0.819 | 0.470 | |||
| IPSL-CM5A-LR | [-] | 6.49 | 8.15 | 24.9 | -4.40 | -16.3 | 22.2 | 0.700 | 0.174 | 0.503 | 0.925 | 0.786 | 0.578 | |||
| IPSL-CM6A-LR | [-] | 11.8 | 14.2 | 24.9 | -4.31 | -10.5 | 19.0 | 0.879 | 0.332 | 0.428 | 0.904 | 0.905 | 0.600 | |||
| MeanCMIP5 | [-] | 12.9 | 11.5 | 25.0 | 14.3 | 11.0 | -13.4 | 19.0 | 0.810 | 0.221 | 0.506 | 0.921 | 0.916 | 0.614 | ||
| MeanCMIP6 | [-] | 8.77 | 10.4 | 24.9 | -1.37 | -14.4 | 21.3 | 0.786 | 0.170 | 0.404 | 0.921 | 0.919 | 0.564 | |||
| MIROC-ESM | [-] | 10.4 | 13.1 | 24.9 | -4.46 | -11.1 | 23.0 | 1.10 | 0.288 | 0.327 | 0.874 | 0.749 | 0.513 | |||
| MIROC-ESM2L | [-] | 3.91 | 4.52 | 24.9 | 1.87 | -19.9 | 27.4 | 0.933 | 0.137 | 0.346 | 0.894 | 0.661 | 0.477 | |||
| MPI-ESM-LR | [-] | 6.27 | 6.65 | 24.9 | -8.65 | -17.6 | 25.8 | 0.894 | 0.109 | 0.337 | 0.897 | 0.776 | 0.491 | |||
| MPI-ESM1.2-HR | [-] | 9.23 | 10.8 | 24.9 | -6.69 | -13.5 | 20.5 | 0.687 | 0.220 | 0.485 | 0.920 | 0.828 | 0.588 | |||
| NorESM1-ME | [-] | 10.0 | 11.8 | 24.9 | -5.08 | -13.0 | 20.4 | 1.07 | 0.305 | 0.446 | 0.880 | 0.635 | 0.543 | |||
| NorESM2-LM | [-] | 11.3 | 12.6 | 24.9 | -1.24 | -12.2 | 22.8 | 1.22 | 0.246 | 0.288 | 0.849 | 0.867 | 0.508 | |||
| UK-HadGEM2-ES | [-] | 10.7 | 13.1 | 25.0 | -1.42 | -12.0 | 20.0 | 0.671 | 0.239 | 0.420 | 0.927 | 0.926 | 0.586 | |||
| UKESM1-0-LL | [-] | 11.0 | 12.7 | 24.9 | -1.30 | -12.1 | 21.9 | 0.999 | 0.250 | 0.301 | 0.888 | 0.944 | 0.537 |
Download Data |
Period Mean (original grids) [watt/m2] |
Model Period Mean (intersection) [watt/m2] |
Benchmark Period Mean (intersection) [watt/m2] |
Model Period Mean (complement) [watt/m2] |
Benchmark Period Mean (complement) [watt/m2] |
Bias [watt/m2] |
RMSE [watt/m2] |
Phase Shift [months] |
Bias Score [1] |
RMSE Score [1] |
Seasonal Cycle Score [1] |
Spatial Distribution Score [1] |
Overall Score [1] |
|||
|---|---|---|---|---|---|---|---|---|---|---|---|---|---|---|---|---|
| Benchmark | [-] | 36.1 | ||||||||||||||
| bcc-csm1-1 | [-] | 61.1 | 62.0 | 36.1 | 49.4 | 25.1 | 35.7 | 1.55 | 0.212 | 0.350 | 0.788 | 0.198 | 0.379 | |||
| BCC-CSM2-MR | [-] | 53.7 | 54.1 | 36.1 | 30.6 | 17.3 | 24.4 | 1.42 | 0.251 | 0.502 | 0.795 | 0.462 | 0.503 | |||
| CanESM2 | [-] | 72.1 | 72.7 | 36.1 | 84.5 | 35.5 | 43.8 | 1.70 | 0.123 | 0.317 | 0.758 | 0.209 | 0.345 | |||
| CanESM5 | [-] | 53.9 | 54.8 | 36.1 | 43.6 | 18.0 | 35.0 | 1.99 | 0.259 | 0.283 | 0.703 | 0.243 | 0.354 | |||
| CESM1-BGC | [-] | 34.3 | 34.2 | 36.1 | 36.1 | -2.24 | 20.9 | 1.27 | 0.402 | 0.508 | 0.843 | 0.367 | 0.526 | |||
| CESM2 | [-] | 42.6 | 42.8 | 36.1 | 37.6 | 6.28 | 15.3 | 1.37 | 0.604 | 0.589 | 0.825 | 0.660 | 0.653 | |||
| GFDL-ESM2G | [-] | 47.4 | 47.4 | 36.1 | 39.2 | 10.9 | 29.9 | 1.42 | 0.475 | 0.145 | 0.816 | 0.427 | 0.401 | |||
| GFDL-ESM4 | [-] | 32.5 | 33.4 | 36.1 | 20.6 | -2.74 | 20.3 | 1.57 | 0.405 | 0.507 | 0.798 | 0.455 | 0.534 | |||
| IPSL-CM5A-LR | [-] | 75.0 | 75.3 | 36.1 | 60.2 | 38.1 | 44.6 | 2.68 | 0.0478 | 0.302 | 0.583 | 0.260 | 0.299 | |||
| IPSL-CM6A-LR | [-] | 34.6 | 34.7 | 36.1 | 26.4 | -1.82 | 10.1 | 1.27 | 0.710 | 0.738 | 0.848 | 0.914 | 0.790 | |||
| MeanCMIP5 | [-] | 47.4 | 48.8 | 36.1 | 28.0 | 12.7 | 20.1 | 1.28 | 0.432 | 0.550 | 0.835 | 0.431 | 0.559 | |||
| MeanCMIP6 | [-] | 38.0 | 38.3 | 36.1 | 26.6 | 2.04 | 13.2 | 1.46 | 0.606 | 0.643 | 0.801 | 0.727 | 0.684 | |||
| MIROC-ESM | [-] | 54.7 | 54.1 | 36.1 | 72.6 | 17.4 | 28.9 | 1.56 | 0.324 | 0.464 | 0.781 | 0.215 | 0.450 | |||
| MIROC-ESM2L | [-] | 17.6 | 17.7 | 36.1 | 21.0 | -18.4 | 26.2 | 1.76 | 0.183 | 0.600 | 0.740 | 0.380 | 0.500 | |||
| MPI-ESM-LR | [-] | 42.6 | 41.7 | 36.1 | 94.4 | 4.58 | 31.0 | 1.51 | 0.335 | 0.359 | 0.800 | 0.154 | 0.402 | |||
| MPI-ESM1.2-HR | [-] | 37.6 | 37.2 | 36.1 | 84.2 | 0.602 | 29.8 | 1.78 | 0.208 | 0.524 | 0.746 | 0.128 | 0.426 | |||
| NorESM1-ME | [-] | 33.1 | 33.0 | 36.1 | 32.1 | -3.25 | 20.1 | 1.25 | 0.400 | 0.527 | 0.843 | 0.415 | 0.542 | |||
| NorESM2-LM | [-] | 42.2 | 42.6 | 36.1 | 33.2 | 6.01 | 13.4 | 1.60 | 0.556 | 0.651 | 0.790 | 0.981 | 0.726 | |||
| UK-HadGEM2-ES | [-] | 25.1 | 25.0 | 36.1 | 28.5 | -11.2 | 22.5 | 1.50 | 0.160 | 0.641 | 0.798 | 0.415 | 0.531 | |||
| UKESM1-0-LL | [-] | 29.7 | 29.9 | 36.1 | 23.3 | -6.61 | 19.1 | 2.13 | 0.382 | 0.575 | 0.700 | 0.576 | 0.561 |
Temporally integrated period mean