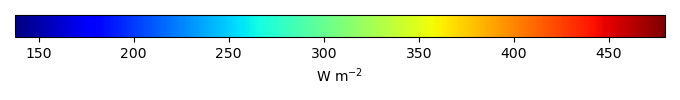
Mean State
Download Data |
Period Mean (original grids) [W m-2] |
Model Period Mean (intersection) [W m-2] |
Benchmark Period Mean (intersection) [W m-2] |
Model Period Mean (complement) [W m-2] |
Benchmark Period Mean (complement) [W m-2] |
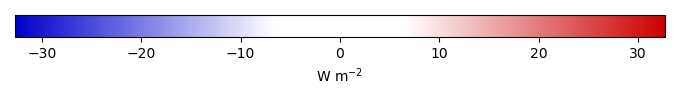
Bias [W m-2] |
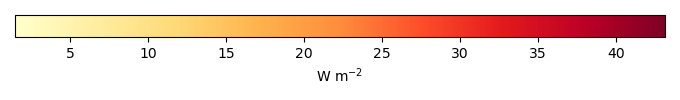
RMSE [W m-2] |
Phase Shift [months] |
Bias Score [1] |
RMSE Score [1] |
Seasonal Cycle Score [1] |
Spatial Distribution Score [1] |
Overall Score [1] |
|||
|---|---|---|---|---|---|---|---|---|---|---|---|---|---|---|---|---|
| Benchmark | [-] | 455. | ||||||||||||||
| bcc-csm1-1 | [-] | 450. | 450. | 455. | 1.75 | 12.5 | 0.978 | 0.476 | 0.546 | 0.884 | 0.994 | 0.689 | ||||
| BCC-CSM2-MR | [-] | 459. | 460. | 455. | 9.15 | 14.0 | 0.943 | 0.353 | 0.576 | 0.893 | 1.00 | 0.680 | ||||
| CanESM2 | [-] | 451. | 451. | 455. | 1.29 | 11.9 | 1.02 | 0.456 | 0.540 | 0.879 | 0.998 | 0.683 | ||||
| CanESM5 | [-] | 456. | 456. | 455. | 5.94 | 13.5 | 0.966 | 0.417 | 0.488 | 0.883 | 0.985 | 0.652 | ||||
| CESM1-BGC | [-] | 447. | 447. | 455. | 1.43 | 13.1 | 0.922 | 0.481 | 0.548 | 0.904 | 0.983 | 0.693 | ||||
| CESM2 | [-] | 466. | 466. | 455. | 12.4 | 15.6 | 0.882 | 0.273 | 0.541 | 0.902 | 1.00 | 0.651 | ||||
| GFDL-ESM2G | [-] | 452. | 452. | 455. | 1.78 | 13.9 | 0.872 | 0.409 | 0.426 | 0.902 | 0.996 | 0.632 | ||||
| GFDL-ESM4 | [-] | 461. | 461. | 455. | 6.64 | 11.3 | 0.732 | 0.511 | 0.558 | 0.918 | 0.974 | 0.704 | ||||
| IPSL-CM5A-LR | [-] | 448. | 449. | 455. | 0.512 | 13.5 | 1.14 | 0.370 | 0.509 | 0.864 | 0.987 | 0.648 | ||||
| IPSL-CM6A-LR | [-] | 458. | 457. | 455. | 4.38 | 11.7 | 0.893 | 0.367 | 0.584 | 0.896 | 0.987 | 0.683 | ||||
| MeanCMIP5 | [-] | 455. | 455. | 455. | 458. | 0.448 | 9.95 | 0.824 | 0.541 | 0.623 | 0.916 | 0.992 | 0.739 | |||
| MeanCMIP6 | [-] | 461. | 461. | 455. | 8.03 | 11.2 | 0.700 | 0.390 | 0.640 | 0.925 | 0.993 | 0.718 | ||||
| MIROC-ESM | [-] | 439. | 439. | 455. | -7.20 | 14.4 | 1.13 | 0.342 | 0.527 | 0.863 | 0.997 | 0.651 | ||||
| MIROC-ESM2L | [-] | 453. | 454. | 455. | 2.87 | 12.6 | 1.03 | 0.435 | 0.578 | 0.879 | 0.989 | 0.692 | ||||
| MPI-ESM-LR | [-] | 453. | 452. | 455. | 1.98 | 12.1 | 0.977 | 0.502 | 0.489 | 0.885 | 0.998 | 0.673 | ||||
| MPI-ESM1.2-HR | [-] | 457. | 457. | 455. | 5.96 | 11.7 | 0.820 | 0.447 | 0.520 | 0.906 | 0.981 | 0.675 | ||||
| NorESM1-ME | [-] | 441. | 442. | 455. | -3.97 | 13.6 | 1.10 | 0.366 | 0.512 | 0.872 | 0.985 | 0.650 | ||||
| NorESM2-LM | [-] | 466. | 466. | 455. | 11.7 | 16.0 | 0.970 | 0.292 | 0.491 | 0.891 | 0.976 | 0.628 | ||||
| UK-HadGEM2-ES | [-] | 459. | 459. | 455. | 4.62 | 11.6 | 0.932 | 0.370 | 0.554 | 0.899 | 0.994 | 0.674 | ||||
| UKESM1-0-LL | [-] | 470. | 470. | 455. | 12.8 | 15.9 | 0.845 | 0.199 | 0.564 | 0.903 | 0.957 | 0.638 |
Download Data |
Period Mean (original grids) [W m-2] |
Model Period Mean (intersection) [W m-2] |
Benchmark Period Mean (intersection) [W m-2] |
Model Period Mean (complement) [W m-2] |
Benchmark Period Mean (complement) [W m-2] |
Bias [W m-2] |
RMSE [W m-2] |
Phase Shift [months] |
Bias Score [1] |
RMSE Score [1] |
Seasonal Cycle Score [1] |
Spatial Distribution Score [1] |
Overall Score [1] |
|||
|---|---|---|---|---|---|---|---|---|---|---|---|---|---|---|---|---|
| Benchmark | [-] | 465. | ||||||||||||||
| bcc-csm1-1 | [-] | 461. | 461. | 465. | 3.28 | 7.27 | 1.75 | 0.321 | 0.803 | 0.744 | 0.594 | 0.653 | ||||
| BCC-CSM2-MR | [-] | 459. | 459. | 465. | 7.80 | 9.31 | 2.12 | 0.272 | 0.815 | 0.683 | 0.930 | 0.703 | ||||
| CanESM2 | [-] | 450. | 450. | 465. | 2.89 | 8.23 | 2.46 | 0.354 | 0.777 | 0.608 | 0.981 | 0.699 | ||||
| CanESM5 | [-] | 462. | 462. | 465. | 6.28 | 8.02 | 1.86 | 0.266 | 0.855 | 0.705 | 0.785 | 0.693 | ||||
| CESM1-BGC | [-] | 450. | 450. | 465. | 4.02 | 6.73 | 2.01 | 0.459 | 0.825 | 0.706 | 0.995 | 0.762 | ||||
| CESM2 | [-] | 460. | 460. | 465. | 9.48 | 10.8 | 2.12 | 0.194 | 0.789 | 0.690 | 0.956 | 0.684 | ||||
| GFDL-ESM2G | [-] | 457. | 457. | 465. | 2.53 | 7.05 | 1.92 | 0.371 | 0.827 | 0.698 | 0.859 | 0.716 | ||||
| GFDL-ESM4 | [-] | 468. | 468. | 465. | 3.46 | 5.79 | 1.68 | 0.480 | 0.826 | 0.743 | 0.985 | 0.772 | ||||
| IPSL-CM5A-LR | [-] | 458. | 458. | 465. | 3.19 | 7.03 | 2.19 | 0.366 | 0.827 | 0.653 | 0.866 | 0.708 | ||||
| IPSL-CM6A-LR | [-] | 457. | 457. | 465. | 4.70 | 7.33 | 1.82 | 0.340 | 0.839 | 0.712 | 0.928 | 0.732 | ||||
| MeanCMIP5 | [-] | 467. | 467. | 465. | 2.20 | 5.64 | 1.45 | 0.430 | 0.859 | 0.801 | 0.796 | 0.749 | ||||
| MeanCMIP6 | [-] | 460. | 460. | 465. | 5.78 | 6.86 | 1.40 | 0.305 | 0.867 | 0.803 | 0.853 | 0.739 | ||||
| MIROC-ESM | [-] | 443. | 443. | 465. | -3.52 | 9.50 | 2.43 | 0.421 | 0.782 | 0.618 | 0.919 | 0.705 | ||||
| MIROC-ESM2L | [-] | 459. | 459. | 465. | 1.97 | 9.44 | 1.91 | 0.340 | 0.762 | 0.717 | 0.829 | 0.682 | ||||
| MPI-ESM-LR | [-] | 451. | 451. | 465. | 4.49 | 7.54 | 1.62 | 0.366 | 0.782 | 0.761 | 0.917 | 0.722 | ||||
| MPI-ESM1.2-HR | [-] | 446. | 446. | 465. | 2.07 | 6.97 | 1.68 | 0.448 | 0.734 | 0.743 | 1.00 | 0.732 | ||||
| NorESM1-ME | [-] | 451. | 451. | 465. | -1.93 | 7.14 | 2.65 | 0.466 | 0.826 | 0.573 | 0.876 | 0.713 | ||||
| NorESM2-LM | [-] | 467. | 467. | 465. | 11.4 | 12.2 | 2.26 | 0.136 | 0.823 | 0.653 | 0.804 | 0.648 | ||||
| UK-HadGEM2-ES | [-] | 459. | 459. | 465. | 4.83 | 8.14 | 1.91 | 0.276 | 0.778 | 0.714 | 0.823 | 0.674 | ||||
| UKESM1-0-LL | [-] | 462. | 462. | 465. | 5.06 | 7.63 | 1.61 | 0.262 | 0.811 | 0.748 | 0.741 | 0.675 |
Download Data |
Period Mean (original grids) [W m-2] |
Model Period Mean (intersection) [W m-2] |
Benchmark Period Mean (intersection) [W m-2] |
Model Period Mean (complement) [W m-2] |
Benchmark Period Mean (complement) [W m-2] |
Bias [W m-2] |
RMSE [W m-2] |
Phase Shift [months] |
Bias Score [1] |
RMSE Score [1] |
Seasonal Cycle Score [1] |
Spatial Distribution Score [1] |
Overall Score [1] |
|||
|---|---|---|---|---|---|---|---|---|---|---|---|---|---|---|---|---|
| Benchmark | [-] | 377. | ||||||||||||||
| bcc-csm1-1 | [-] | 375. | 374. | 377. | 0.308 | 16.2 | 0.680 | 0.412 | 0.481 | 0.920 | 0.997 | 0.658 | ||||
| BCC-CSM2-MR | [-] | 375. | 375. | 377. | 1.70 | 14.1 | 0.601 | 0.458 | 0.536 | 0.931 | 0.999 | 0.692 | ||||
| CanESM2 | [-] | 376. | 375. | 377. | 1.22 | 18.9 | 0.653 | 0.376 | 0.438 | 0.923 | 0.999 | 0.635 | ||||
| CanESM5 | [-] | 373. | 373. | 377. | 0.231 | 17.5 | 0.609 | 0.350 | 0.495 | 0.931 | 0.999 | 0.654 | ||||
| CESM1-BGC | [-] | 373. | 373. | 377. | -0.00686 | 14.5 | 0.643 | 0.397 | 0.555 | 0.930 | 0.999 | 0.687 | ||||
| CESM2 | [-] | 382. | 382. | 377. | 8.30 | 15.8 | 0.696 | 0.325 | 0.533 | 0.927 | 0.999 | 0.663 | ||||
| GFDL-ESM2G | [-] | 376. | 375. | 377. | 1.71 | 17.0 | 0.661 | 0.421 | 0.445 | 0.926 | 0.997 | 0.647 | ||||
| GFDL-ESM4 | [-] | 379. | 379. | 377. | 1.99 | 13.4 | 0.556 | 0.481 | 0.529 | 0.944 | 0.999 | 0.697 | ||||
| IPSL-CM5A-LR | [-] | 370. | 369. | 377. | -3.21 | 17.2 | 0.764 | 0.364 | 0.501 | 0.914 | 0.997 | 0.655 | ||||
| IPSL-CM6A-LR | [-] | 372. | 372. | 377. | -0.145 | 15.2 | 0.691 | 0.411 | 0.506 | 0.926 | 0.999 | 0.670 | ||||
| MeanCMIP5 | [-] | 377. | 377. | 378. | 417. | -0.417 | 12.3 | 0.510 | 0.462 | 0.628 | 0.947 | 0.998 | 0.733 | |||
| MeanCMIP6 | [-] | 377. | 377. | 377. | 3.57 | 10.9 | 0.448 | 0.511 | 0.659 | 0.955 | 1.00 | 0.757 | ||||
| MIROC-ESM | [-] | 372. | 372. | 377. | -1.38 | 20.1 | 0.651 | 0.297 | 0.427 | 0.924 | 0.994 | 0.614 | ||||
| MIROC-ESM2L | [-] | 383. | 383. | 377. | 8.11 | 18.8 | 0.592 | 0.393 | 0.540 | 0.932 | 0.985 | 0.678 | ||||
| MPI-ESM-LR | [-] | 384. | 372. | 377. | 0.0842 | 15.5 | 0.655 | 0.453 | 0.503 | 0.930 | 0.999 | 0.678 | ||||
| MPI-ESM1.2-HR | [-] | 376. | 376. | 377. | 2.55 | 12.7 | 0.596 | 0.508 | 0.577 | 0.938 | 1.00 | 0.720 | ||||
| NorESM1-ME | [-] | 370. | 370. | 377. | -4.46 | 16.8 | 0.683 | 0.328 | 0.510 | 0.923 | 0.999 | 0.654 | ||||
| NorESM2-LM | [-] | 383. | 383. | 377. | 7.51 | 17.4 | 0.700 | 0.345 | 0.476 | 0.927 | 0.999 | 0.644 | ||||
| UK-HadGEM2-ES | [-] | 376. | 376. | 378. | 1.94 | 15.6 | 0.639 | 0.437 | 0.498 | 0.931 | 0.999 | 0.673 | ||||
| UKESM1-0-LL | [-] | 375. | 375. | 377. | 1.93 | 14.1 | 0.542 | 0.423 | 0.564 | 0.944 | 0.999 | 0.699 |
Download Data |
Period Mean (original grids) [W m-2] |
Model Period Mean (intersection) [W m-2] |
Benchmark Period Mean (intersection) [W m-2] |
Model Period Mean (complement) [W m-2] |
Benchmark Period Mean (complement) [W m-2] |
Bias [W m-2] |
RMSE [W m-2] |
Phase Shift [months] |
Bias Score [1] |
RMSE Score [1] |
Seasonal Cycle Score [1] |
Spatial Distribution Score [1] |
Overall Score [1] |
|||
|---|---|---|---|---|---|---|---|---|---|---|---|---|---|---|---|---|
| Benchmark | [-] | 306. | ||||||||||||||
| bcc-csm1-1 | [-] | 301. | 302. | 306. | -4.91 | 17.9 | 0.282 | 0.440 | 0.381 | 0.976 | 0.975 | 0.631 | ||||
| BCC-CSM2-MR | [-] | 297. | 297. | 306. | -5.56 | 14.0 | 0.275 | 0.593 | 0.428 | 0.980 | 0.994 | 0.685 | ||||
| CanESM2 | [-] | 302. | 302. | 306. | -0.532 | 17.1 | 0.286 | 0.415 | 0.275 | 0.974 | 0.996 | 0.587 | ||||
| CanESM5 | [-] | 302. | 302. | 306. | -3.21 | 14.6 | 0.267 | 0.426 | 0.467 | 0.980 | 0.996 | 0.667 | ||||
| CESM1-BGC | [-] | 304. | 304. | 306. | 0.129 | 13.5 | 0.258 | 0.347 | 0.481 | 0.981 | 0.984 | 0.655 | ||||
| CESM2 | [-] | 308. | 308. | 306. | 5.85 | 14.9 | 0.323 | 0.282 | 0.402 | 0.974 | 1.00 | 0.612 | ||||
| GFDL-ESM2G | [-] | 298. | 299. | 306. | -7.35 | 16.6 | 0.294 | 0.487 | 0.388 | 0.979 | 0.999 | 0.648 | ||||
| GFDL-ESM4 | [-] | 307. | 307. | 306. | 0.400 | 12.2 | 0.259 | 0.512 | 0.452 | 0.980 | 0.997 | 0.679 | ||||
| IPSL-CM5A-LR | [-] | 303. | 302. | 306. | -2.72 | 15.0 | 0.253 | 0.445 | 0.474 | 0.981 | 0.999 | 0.674 | ||||
| IPSL-CM6A-LR | [-] | 303. | 303. | 306. | 3.35 | 14.9 | 0.290 | 0.455 | 0.352 | 0.974 | 1.00 | 0.626 | ||||
| MeanCMIP5 | [-] | 305. | 305. | 307. | 349. | -1.89 | 10.4 | 0.230 | 0.533 | 0.611 | 0.983 | 0.999 | 0.747 | |||
| MeanCMIP6 | [-] | 303. | 303. | 306. | -0.175 | 9.05 | 0.203 | 0.601 | 0.621 | 0.985 | 1.00 | 0.766 | ||||
| MIROC-ESM | [-] | 308. | 309. | 306. | 7.03 | 17.0 | 0.282 | 0.303 | 0.325 | 0.979 | 0.998 | 0.586 | ||||
| MIROC-ESM2L | [-] | 307. | 307. | 306. | 1.65 | 15.2 | 0.260 | 0.367 | 0.459 | 0.980 | 0.997 | 0.652 | ||||
| MPI-ESM-LR | [-] | 305. | 300. | 306. | -0.693 | 12.0 | 0.316 | 0.562 | 0.441 | 0.975 | 1.00 | 0.684 | ||||
| MPI-ESM1.2-HR | [-] | 304. | 304. | 306. | 1.17 | 12.0 | 0.263 | 0.509 | 0.499 | 0.979 | 0.996 | 0.696 | ||||
| NorESM1-ME | [-] | 301. | 299. | 306. | -5.31 | 15.7 | 0.376 | 0.308 | 0.419 | 0.974 | 0.975 | 0.619 | ||||
| NorESM2-LM | [-] | 307. | 305. | 306. | 2.72 | 14.8 | 0.391 | 0.426 | 0.293 | 0.972 | 1.00 | 0.597 | ||||
| UK-HadGEM2-ES | [-] | 300. | 301. | 307. | -3.12 | 14.6 | 0.371 | 0.495 | 0.376 | 0.965 | 0.991 | 0.641 | ||||
| UKESM1-0-LL | [-] | 293. | 293. | 306. | -7.93 | 12.7 | 0.243 | 0.400 | 0.502 | 0.982 | 0.986 | 0.675 |
Download Data |
Period Mean (original grids) [W m-2] |
Model Period Mean (intersection) [W m-2] |
Benchmark Period Mean (intersection) [W m-2] |
Model Period Mean (complement) [W m-2] |
Benchmark Period Mean (complement) [W m-2] |
Bias [W m-2] |
RMSE [W m-2] |
Phase Shift [months] |
Bias Score [1] |
RMSE Score [1] |
Seasonal Cycle Score [1] |
Spatial Distribution Score [1] |
Overall Score [1] |
|||
|---|---|---|---|---|---|---|---|---|---|---|---|---|---|---|---|---|
| Benchmark | [-] | 446. | ||||||||||||||
| bcc-csm1-1 | [-] | 457. | 458. | 446. | 12.1 | 18.3 | 2.14 | 0.188 | 0.587 | 0.669 | 0.967 | 0.599 | ||||
| BCC-CSM2-MR | [-] | 460. | 460. | 446. | 14.0 | 17.3 | 1.53 | 0.174 | 0.655 | 0.789 | 0.928 | 0.640 | ||||
| CanESM2 | [-] | 476. | 478. | 446. | 31.0 | 38.9 | 1.58 | 0.0689 | 0.353 | 0.777 | 0.425 | 0.396 | ||||
| CanESM5 | [-] | 468. | 470. | 446. | 23.5 | 30.6 | 1.57 | 0.0830 | 0.330 | 0.779 | 0.636 | 0.432 | ||||
| CESM1-BGC | [-] | 451. | 451. | 446. | 5.57 | 10.6 | 1.92 | 0.489 | 0.698 | 0.715 | 0.938 | 0.708 | ||||
| CESM2 | [-] | 458. | 458. | 446. | 12.4 | 14.7 | 1.60 | 0.189 | 0.713 | 0.779 | 0.977 | 0.674 | ||||
| GFDL-ESM2G | [-] | 460. | 460. | 446. | 14.1 | 22.8 | 1.80 | 0.145 | 0.256 | 0.733 | 0.925 | 0.463 | ||||
| GFDL-ESM4 | [-] | 459. | 459. | 446. | 13.3 | 19.6 | 1.49 | 0.290 | 0.420 | 0.796 | 0.810 | 0.547 | ||||
| IPSL-CM5A-LR | [-] | 457. | 457. | 446. | 11.0 | 17.3 | 1.76 | 0.237 | 0.585 | 0.750 | 0.955 | 0.622 | ||||
| IPSL-CM6A-LR | [-] | 455. | 455. | 446. | 9.44 | 13.2 | 1.76 | 0.241 | 0.750 | 0.744 | 0.988 | 0.695 | ||||
| MeanCMIP5 | [-] | 456. | 456. | 446. | 9.84 | 14.7 | 1.63 | 0.245 | 0.694 | 0.771 | 0.976 | 0.676 | ||||
| MeanCMIP6 | [-] | 457. | 457. | 446. | 11.6 | 14.4 | 1.24 | 0.211 | 0.722 | 0.846 | 0.989 | 0.698 | ||||
| MIROC-ESM | [-] | 446. | 446. | 446. | 0.786 | 14.4 | 1.66 | 0.397 | 0.614 | 0.764 | 0.927 | 0.663 | ||||
| MIROC-ESM2L | [-] | 450. | 451. | 446. | 5.58 | 13.6 | 2.11 | 0.303 | 0.661 | 0.687 | 0.990 | 0.661 | ||||
| MPI-ESM-LR | [-] | 456. | 456. | 446. | 11.0 | 18.2 | 1.83 | 0.242 | 0.517 | 0.737 | 0.854 | 0.573 | ||||
| MPI-ESM1.2-HR | [-] | 449. | 449. | 446. | 3.81 | 12.4 | 1.42 | 0.441 | 0.677 | 0.804 | 0.869 | 0.694 | ||||
| NorESM1-ME | [-] | 446. | 446. | 446. | 0.622 | 11.3 | 1.63 | 0.467 | 0.713 | 0.763 | 0.953 | 0.722 | ||||
| NorESM2-LM | [-] | 455. | 455. | 446. | 10.3 | 14.3 | 1.43 | 0.251 | 0.684 | 0.811 | 0.995 | 0.685 | ||||
| UK-HadGEM2-ES | [-] | 448. | 448. | 446. | 2.99 | 12.0 | 1.59 | 0.421 | 0.653 | 0.777 | 0.964 | 0.694 | ||||
| UKESM1-0-LL | [-] | 459. | 458. | 446. | 13.0 | 17.0 | 1.43 | 0.210 | 0.591 | 0.807 | 0.977 | 0.635 |
Temporally integrated period mean