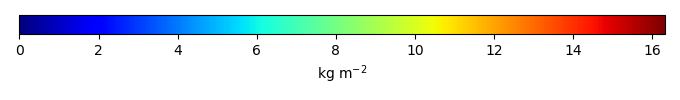
Mean State
Download Data |
Period Mean (original grids) [Pg] |
Model Period Mean (intersection) [Pg] |
Benchmark Period Mean (intersection) [Pg] |
Model Period Mean (complement) [Pg] |
Benchmark Period Mean (complement) [Pg] |
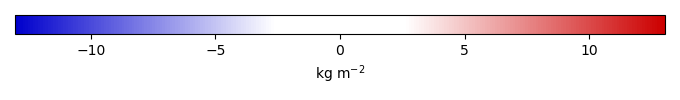
Bias [kg m-2] |
Bias Score [1] |
Spatial Distribution Score [1] |
Overall Score [1] |
|||
|---|---|---|---|---|---|---|---|---|---|---|---|---|
| Benchmark | [-] | 0.203 | ||||||||||
| ACCESS-ESM1-5 | [-] | 91.1 | 0.244 | 0.203 | 92.4 | 1.58 | 0.810 | 0.871 | 0.841 | |||
| BCC-CSM2-MR | [-] | 56.2 | 0.0947 | 0.203 | 55.6 | -2.94 | 0.515 | 0.805 | 0.660 | |||
| CanESM5 | [-] | 56.6 | 0.0958 | 0.203 | 53.0 | -3.09 | 0.511 | 0.706 | 0.609 | |||
| CESM2 | [-] | 73.9 | 0.0862 | 0.203 | 73.2 | -3.38 | 0.504 | 0.658 | 0.581 | |||
| GFDL-ESM4 | [-] | 65.6 | 0.0607 | 0.203 | 66.4 | -4.06 | 0.463 | 0.632 | 0.548 | |||
| IPSL-CM6A-LR | [-] | 21.0 | 0.0556 | 0.203 | 20.9 | -4.30 | 0.491 | 0.381 | 0.436 | |||
| MeanCMIP6 | [-] | 52.1 | 0.0702 | 0.203 | 53.6 | -3.78 | 0.470 | 0.696 | 0.583 | |||
| MIROC-ESM2L | [-] | 57.1 | 0.0803 | 0.203 | 53.6 | -3.25 | 0.521 | 0.749 | 0.635 | |||
| NorESM2-LM | [-] | 66.1 | 0.0237 | 0.203 | 63.8 | -4.93 | 0.376 | 0.456 | 0.416 | |||
| UKESM1-0-LL | [-] | 58.0 | 0.0915 | 0.203 | 56.3 | -3.40 | 0.516 | 0.866 | 0.691 |
Download Data |
Period Mean (original grids) [Pg] |
Model Period Mean (intersection) [Pg] |
Benchmark Period Mean (intersection) [Pg] |
Model Period Mean (complement) [Pg] |
Benchmark Period Mean (complement) [Pg] |
Bias [kg m-2] |
Bias Score [1] |
Spatial Distribution Score [1] |
Overall Score [1] |
|||
|---|---|---|---|---|---|---|---|---|---|---|---|---|
| Benchmark | [-] | 26.2 | ||||||||||
| ACCESS-ESM1-5 | [-] | 662. | 35.1 | 26.1 | 626. | 0.0268 | 1.28 | 0.628 | 0.879 | 0.754 | ||
| BCC-CSM2-MR | [-] | 386. | 20.0 | 26.0 | 365. | 0.135 | -0.615 | 0.632 | 0.792 | 0.712 | ||
| CanESM5 | [-] | 509. | 32.7 | 26.2 | 468. | 1.28 | 0.600 | 0.878 | 0.739 | |||
| CESM2 | [-] | 485. | 11.3 | 26.1 | 472. | 0.0852 | -1.58 | 0.548 | 0.705 | 0.626 | ||
| GFDL-ESM4 | [-] | 405. | 12.6 | 26.2 | 393. | -1.66 | 0.532 | 0.406 | 0.469 | |||
| IPSL-CM6A-LR | [-] | 350. | 16.4 | 26.0 | 332. | 0.170 | -1.01 | 0.586 | 0.456 | 0.521 | ||
| MeanCMIP6 | [-] | 460. | 21.1 | 26.2 | 438. | -0.293 | 0.653 | 0.711 | 0.682 | |||
| MIROC-ESM2L | [-] | 520. | 33.3 | 26.2 | 476. | 0.000288 | 1.32 | 0.558 | 0.851 | 0.704 | ||
| NorESM2-LM | [-] | 463. | 10.9 | 26.2 | 446. | -1.46 | 0.550 | 0.726 | 0.638 | |||
| UKESM1-0-LL | [-] | 545. | 23.5 | 26.0 | 519. | 0.161 | 0.0936 | 0.597 | 0.801 | 0.699 |
Download Data |
Period Mean (original grids) [Pg] |
Model Period Mean (intersection) [Pg] |
Benchmark Period Mean (intersection) [Pg] |
Model Period Mean (complement) [Pg] |
Benchmark Period Mean (complement) [Pg] |
Bias [kg m-2] |
Bias Score [1] |
Spatial Distribution Score [1] |
Overall Score [1] |
|||
|---|---|---|---|---|---|---|---|---|---|---|---|---|
| Benchmark | [-] | 0.0267 | ||||||||||
| ACCESS-ESM1-5 | [-] | 15.6 | 0.394 | 0.0267 | 15.5 | 0.988 | 0.329 | 0.0506 | 0.190 | |||
| BCC-CSM2-MR | [-] | 10.6 | 0.227 | 0.0267 | 11.1 | 0.537 | 0.326 | 0.564 | 0.445 | |||
| CanESM5 | [-] | 24.1 | 0.824 | 0.0267 | 22.3 | 2.13 | 0.176 | 0.158 | 0.167 | |||
| CESM2 | [-] | 6.23 | 0.0891 | 0.0267 | 5.63 | 0.190 | 0.392 | 0.515 | 0.454 | |||
| GFDL-ESM4 | [-] | 2.90 | 0.128 | 0.0267 | 2.78 | 0.261 | 0.467 | 0.678 | 0.572 | |||
| IPSL-CM6A-LR | [-] | 15.8 | 0.465 | 0.0267 | 12.1 | 1.14 | 0.271 | 0.136 | 0.204 | |||
| MeanCMIP6 | [-] | 12.7 | 0.272 | 0.0267 | 12.1 | 0.661 | 0.332 | 0.411 | 0.371 | |||
| MIROC-ESM2L | [-] | 17.3 | 0.189 | 0.0267 | 16.7 | 0.420 | 0.377 | 0.0330 | 0.205 | |||
| NorESM2-LM | [-] | 6.82 | 0.0887 | 0.0267 | 5.51 | 0.191 | 0.456 | 0.424 | 0.440 | |||
| UKESM1-0-LL | [-] | 11.6 | 0.0302 | 0.0266 | 11.6 | 0.000128 | 0.00976 | 0.450 | 0.574 | 0.512 |
Download Data |
Period Mean (original grids) [Pg] |
Model Period Mean (intersection) [Pg] |
Benchmark Period Mean (intersection) [Pg] |
Model Period Mean (complement) [Pg] |
Benchmark Period Mean (complement) [Pg] |
Bias [kg m-2] |
Bias Score [1] |
Spatial Distribution Score [1] |
Overall Score [1] |
|||
|---|---|---|---|---|---|---|---|---|---|---|---|---|
| Benchmark | [-] | 0.894 | ||||||||||
| ACCESS-ESM1-5 | [-] | 4.50 | 0.863 | 0.894 | 2.87 | 0.0583 | 0.498 | 0.623 | 0.560 | |||
| BCC-CSM2-MR | [-] | 4.74 | 1.00 | 0.891 | 3.62 | 0.00278 | 0.111 | 0.512 | 0.201 | 0.356 | ||
| CanESM5 | [-] | 4.68 | 1.73 | 0.894 | 3.60 | 0.824 | 0.510 | 0.348 | 0.429 | |||
| CESM2 | [-] | 3.22 | 0.296 | 0.891 | 2.76 | 0.00246 | -0.477 | 0.441 | 0.188 | 0.315 | ||
| GFDL-ESM4 | [-] | 3.75 | 0.751 | 0.894 | 2.88 | -0.0993 | 0.489 | 0.149 | 0.319 | |||
| IPSL-CM6A-LR | [-] | 3.65 | 1.80 | 0.892 | 1.44 | 0.00202 | 0.888 | 0.508 | 0.495 | 0.501 | ||
| MeanCMIP6 | [-] | 4.72 | 0.927 | 0.894 | 3.35 | 0.0754 | 0.522 | 0.141 | 0.331 | |||
| MIROC-ESM2L | [-] | 3.94 | 0.563 | 0.894 | 3.34 | -0.277 | 0.423 | 0.549 | 0.486 | |||
| NorESM2-LM | [-] | 3.50 | 0.196 | 0.894 | 2.66 | -0.612 | 0.426 | 0.0686 | 0.247 | |||
| UKESM1-0-LL | [-] | 4.50 | 0.999 | 0.894 | 4.14 | 1.68e-05 | 0.203 | 0.422 | 0.608 | 0.515 |
Download Data |
Period Mean (original grids) [Pg] |
Model Period Mean (intersection) [Pg] |
Benchmark Period Mean (intersection) [Pg] |
Model Period Mean (complement) [Pg] |
Benchmark Period Mean (complement) [Pg] |
Bias [kg m-2] |
Bias Score [1] |
Spatial Distribution Score [1] |
Overall Score [1] |
|||
|---|---|---|---|---|---|---|---|---|---|---|---|---|
| Benchmark | [-] | 0.0459 | ||||||||||
| ACCESS-ESM1-5 | [-] | 7.93 | 0.0183 | 0.0459 | 5.51 | -10.1 | 0.632 | 1.00 | 0.816 | |||
| BCC-CSM2-MR | [-] | 4.07 | 0.0205 | 0.0459 | 3.76 | -10.2 | 0.632 | 1.78e-24 | 0.316 | |||
| CanESM5 | [-] | 3.54 | 0.0198 | 0.0459 | 2.67 | -11.5 | 0.594 | 1.00 | 0.797 | |||
| CESM2 | [-] | 4.64 | 0.0100 | 0.0459 | 4.01 | -18.3 | 0.440 | 4.43e-25 | 0.220 | |||
| GFDL-ESM4 | [-] | 4.20 | 0.0136 | 0.0459 | 4.40 | -15.5 | 0.495 | 1.00 | 0.748 | |||
| IPSL-CM6A-LR | [-] | 2.61 | 0.00662 | 0.0459 | 1.73 | -18.7 | 0.429 | 5.07e-23 | 0.214 | |||
| MeanCMIP6 | [-] | 3.96 | 0.0139 | 0.0459 | 3.20 | -14.7 | 0.514 | 1.00 | 0.757 | |||
| MIROC-ESM2L | [-] | 3.50 | 0.0215 | 0.0459 | 2.94 | -11.4 | 0.597 | 1.00 | 0.799 | |||
| NorESM2-LM | [-] | 7.04 | 9.44e-06 | 0.0459 | 3.84 | -22.1 | 0.368 | 1.00 | 0.684 | |||
| UKESM1-0-LL | [-] | 3.37 | 0.0147 | 0.0459 | 3.68 | -15.0 | 0.507 | 1.00 | 0.753 |
Download Data |
Period Mean (original grids) [Pg] |
Model Period Mean (intersection) [Pg] |
Benchmark Period Mean (intersection) [Pg] |
Model Period Mean (complement) [Pg] |
Benchmark Period Mean (complement) [Pg] |
Bias [kg m-2] |
Bias Score [1] |
Spatial Distribution Score [1] |
Overall Score [1] |
|||
|---|---|---|---|---|---|---|---|---|---|---|---|---|
| Benchmark | [-] | 19.1 | ||||||||||
| ACCESS-ESM1-5 | [-] | 134. | 24.9 | 19.0 | 107. | 0.0272 | 1.94 | 0.648 | 0.906 | 0.777 | ||
| BCC-CSM2-MR | [-] | 66.1 | 13.3 | 18.9 | 53.7 | 0.132 | -1.42 | 0.652 | 0.830 | 0.741 | ||
| CanESM5 | [-] | 83.4 | 22.9 | 19.1 | 60.2 | 1.78 | 0.632 | 0.906 | 0.769 | |||
| CESM2 | [-] | 65.0 | 9.01 | 19.0 | 55.4 | 0.0617 | -2.59 | 0.580 | 0.793 | 0.686 | ||
| GFDL-ESM4 | [-] | 52.9 | 8.87 | 19.1 | 43.0 | -2.96 | 0.549 | 0.382 | 0.465 | |||
| IPSL-CM6A-LR | [-] | 35.9 | 8.69 | 19.0 | 26.8 | 0.113 | -2.75 | 0.587 | 0.466 | 0.527 | ||
| MeanCMIP6 | [-] | 65.3 | 13.8 | 19.1 | 50.5 | -1.07 | 0.681 | 0.653 | 0.667 | |||
| MIROC-ESM2L | [-] | 75.4 | 21.4 | 19.1 | 53.5 | 0.000251 | 1.11 | 0.592 | 0.872 | 0.732 | ||
| NorESM2-LM | [-] | 59.0 | 9.12 | 19.1 | 53.5 | -2.16 | 0.589 | 0.801 | 0.695 | |||
| UKESM1-0-LL | [-] | 63.2 | 12.5 | 18.9 | 53.8 | 0.154 | -1.54 | 0.628 | 0.759 | 0.694 |
Download Data |
Period Mean (original grids) [Pg] |
Model Period Mean (intersection) [Pg] |
Benchmark Period Mean (intersection) [Pg] |
Model Period Mean (complement) [Pg] |
Benchmark Period Mean (complement) [Pg] |
Bias [kg m-2] |
Bias Score [1] |
Spatial Distribution Score [1] |
Overall Score [1] |
|||
|---|---|---|---|---|---|---|---|---|---|---|---|---|
| Benchmark | [-] | 1.93 | ||||||||||
| ACCESS-ESM1-5 | [-] | 264. | 2.67 | 1.92 | 258. | 0.00140 | 1.55 | 0.639 | 0.917 | 0.778 | ||
| BCC-CSM2-MR | [-] | 152. | 2.42 | 1.92 | 148. | 0.000278 | 0.976 | 0.645 | 0.891 | 0.768 | ||
| CanESM5 | [-] | 226. | 3.20 | 1.93 | 222. | 3.77 | 0.484 | 0.819 | 0.651 | |||
| CESM2 | [-] | 202. | 1.02 | 1.91 | 201. | 0.0189 | -0.643 | 0.528 | 0.798 | 0.663 | ||
| GFDL-ESM4 | [-] | 110. | 0.303 | 1.93 | 114. | -2.26 | 0.420 | 0.0275 | 0.224 | |||
| IPSL-CM6A-LR | [-] | 195. | 1.87 | 1.88 | 191. | 0.0477 | 0.707 | 0.701 | 0.879 | 0.790 | ||
| MeanCMIP6 | [-] | 213. | 2.43 | 1.93 | 210. | 1.89 | 0.645 | 0.913 | 0.779 | |||
| MIROC-ESM2L | [-] | 238. | 4.09 | 1.93 | 230. | 5.11 | 0.457 | 0.902 | 0.679 | |||
| NorESM2-LM | [-] | 194. | 0.882 | 1.93 | 194. | -0.554 | 0.530 | 0.795 | 0.663 | |||
| UKESM1-0-LL | [-] | 291. | 3.19 | 1.92 | 281. | 0.00175 | 4.25 | 0.461 | 0.579 | 0.520 |
Download Data |
Period Mean (original grids) [Pg] |
Model Period Mean (intersection) [Pg] |
Benchmark Period Mean (intersection) [Pg] |
Model Period Mean (complement) [Pg] |
Benchmark Period Mean (complement) [Pg] |
Bias [kg m-2] |
Bias Score [1] |
Spatial Distribution Score [1] |
Overall Score [1] |
|||
|---|---|---|---|---|---|---|---|---|---|---|---|---|
| Benchmark | [-] | 4.00 | ||||||||||
| ACCESS-ESM1-5 | [-] | 58.8 | 5.92 | 4.00 | 53.3 | 0.822 | 0.553 | 0.816 | 0.685 | |||
| BCC-CSM2-MR | [-] | 28.6 | 2.89 | 4.00 | 25.1 | 0.00130 | -0.477 | 0.565 | 0.516 | 0.540 | ||
| CanESM5 | [-] | 35.2 | 3.89 | 4.00 | 31.7 | -0.0826 | 0.533 | 0.690 | 0.612 | |||
| CESM2 | [-] | 20.3 | 0.737 | 4.00 | 19.2 | 0.00385 | -1.26 | 0.430 | 0.114 | 0.272 | ||
| GFDL-ESM4 | [-] | 20.2 | 2.41 | 4.00 | 17.0 | -0.644 | 0.518 | 0.423 | 0.470 | |||
| IPSL-CM6A-LR | [-] | 21.9 | 3.47 | 4.00 | 17.3 | 0.00672 | -0.214 | 0.559 | 0.445 | 0.502 | ||
| MeanCMIP6 | [-] | 30.9 | 3.50 | 4.00 | 26.9 | -0.162 | 0.562 | 0.406 | 0.484 | |||
| MIROC-ESM2L | [-] | 48.9 | 6.88 | 4.00 | 45.1 | 1.33 | 0.479 | 0.752 | 0.616 | |||
| NorESM2-LM | [-] | 24.2 | 0.567 | 4.00 | 21.4 | -1.36 | 0.410 | 0.0914 | 0.251 | |||
| UKESM1-0-LL | [-] | 35.8 | 6.58 | 4.00 | 27.0 | 0.00401 | 1.08 | 0.561 | 0.758 | 0.659 |
Temporally integrated period mean