Mean State
Download Data |
Period Mean (original grids) [Pg] |
Model Period Mean (intersection) [Pg] |
Benchmark Period Mean (intersection) [Pg] |
Model Period Mean (complement) [Pg] |
Benchmark Period Mean (complement) [Pg] |
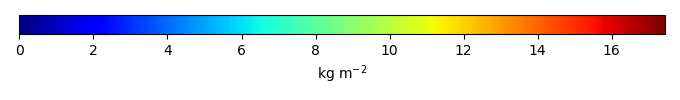
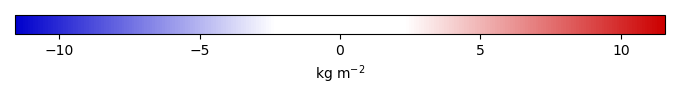
Bias [kg m-2] |
Bias Score [1] |
Spatial Distribution Score [1] |
Overall Score [1] |
|||
|---|---|---|---|---|---|---|---|---|---|---|---|---|
| Benchmark | [-] | 5.77 | ||||||||||
| ACCESS-ESM1-5 | [-] | 90.9 | 2.31 | 5.77 | 90.2 | -2.42 | 0.427 | 0.220 | 0.323 | |||
| BCC-CSM2-MR | [-] | 56.1 | 1.99 | 5.77 | 53.6 | -2.69 | 0.515 | 0.605 | 0.560 | |||
| CanESM5 | [-] | 56.5 | 0.546 | 5.77 | 52.4 | -3.93 | 0.406 | 0.662 | 0.534 | |||
| CESM2 | [-] | 73.8 | 2.58 | 5.77 | 70.6 | -2.38 | 0.565 | 0.734 | 0.649 | |||
| GFDL-ESM4 | [-] | 65.5 | 4.24 | 5.77 | 62.1 | -1.15 | 0.651 | 0.718 | 0.685 | |||
| IPSL-CM6A-LR | [-] | 20.9 | 0.0929 | 5.77 | 20.8 | -4.27 | 0.376 | 0.230 | 0.303 | |||
| MeanCMIP6 | [-] | 52.0 | 1.95 | 5.77 | 51.6 | -2.87 | 0.522 | 0.909 | 0.715 | |||
| MIROC-ESM2L | [-] | 57.0 | 1.18 | 5.77 | 52.4 | -3.47 | 0.435 | 0.634 | 0.535 | |||
| NorESM2-LM | [-] | 65.9 | 2.48 | 5.77 | 61.2 | -2.50 | 0.546 | 0.740 | 0.643 | |||
| UKESM1-0-LL | [-] | 57.9 | 5.16 | 5.77 | 51.1 | -0.453 | 0.606 | 0.463 | 0.534 |
Download Data |
Period Mean (original grids) [Pg] |
Model Period Mean (intersection) [Pg] |
Benchmark Period Mean (intersection) [Pg] |
Model Period Mean (complement) [Pg] |
Benchmark Period Mean (complement) [Pg] |
Bias [kg m-2] |
Bias Score [1] |
Spatial Distribution Score [1] |
Overall Score [1] |
|||
|---|---|---|---|---|---|---|---|---|---|---|---|---|
| Benchmark | [-] | 349. | ||||||||||
| ACCESS-ESM1-5 | [-] | 662. | 419. | 347. | 242. | 1.67 | 1.33 | 0.616 | 0.840 | 0.728 | ||
| BCC-CSM2-MR | [-] | 385. | 245. | 347. | 139. | 1.74 | -1.22 | 0.654 | 0.901 | 0.778 | ||
| CanESM5 | [-] | 509. | 332. | 349. | 168. | 0.690 | 0.605 | 0.868 | 0.737 | |||
| CESM2 | [-] | 485. | 327. | 347. | 156. | 2.11 | 0.293 | 0.615 | 0.821 | 0.718 | ||
| GFDL-ESM4 | [-] | 405. | 201. | 349. | 204. | -2.07 | 0.530 | 0.832 | 0.681 | |||
| IPSL-CM6A-LR | [-] | 350. | 278. | 347. | 69.7 | 1.46 | -0.491 | 0.674 | 0.925 | 0.800 | ||
| MeanCMIP6 | [-] | 459. | 320. | 349. | 139. | 0.250 | 0.713 | 0.944 | 0.829 | |||
| MIROC-ESM2L | [-] | 519. | 327. | 348. | 182. | 0.459 | 0.355 | 0.617 | 0.878 | 0.747 | ||
| NorESM2-LM | [-] | 462. | 314. | 349. | 143. | 0.369 | 0.619 | 0.834 | 0.727 | |||
| UKESM1-0-LL | [-] | 545. | 414. | 347. | 128. | 1.80 | 1.79 | 0.639 | 0.862 | 0.751 |
Download Data |
Period Mean (original grids) [Pg] |
Model Period Mean (intersection) [Pg] |
Benchmark Period Mean (intersection) [Pg] |
Model Period Mean (complement) [Pg] |
Benchmark Period Mean (complement) [Pg] |
Bias [kg m-2] |
Bias Score [1] |
Spatial Distribution Score [1] |
Overall Score [1] |
|||
|---|---|---|---|---|---|---|---|---|---|---|---|---|
| Benchmark | [-] | 20.1 | ||||||||||
| ACCESS-ESM1-5 | [-] | 15.6 | 13.8 | 20.1 | 2.11 | 0.0541 | -0.365 | 0.494 | 0.704 | 0.599 | ||
| BCC-CSM2-MR | [-] | 10.7 | 9.87 | 20.1 | 1.43 | 0.0646 | -0.613 | 0.541 | 0.727 | 0.634 | ||
| CanESM5 | [-] | 24.1 | 19.5 | 20.1 | 3.62 | 0.0627 | 0.507 | 0.668 | 0.588 | |||
| CESM2 | [-] | 6.24 | 4.72 | 20.0 | 0.998 | 0.0870 | -0.926 | 0.445 | 0.459 | 0.452 | ||
| GFDL-ESM4 | [-] | 2.90 | 2.11 | 20.1 | 0.800 | -1.10 | 0.395 | 0.342 | 0.369 | |||
| IPSL-CM6A-LR | [-] | 15.8 | 12.0 | 20.0 | 0.596 | 0.0730 | -0.482 | 0.470 | 0.730 | 0.600 | ||
| MeanCMIP6 | [-] | 12.7 | 11.1 | 20.1 | 1.30 | -0.500 | 0.485 | 0.764 | 0.625 | |||
| MIROC-ESM2L | [-] | 17.3 | 15.9 | 20.1 | 0.916 | 0.0335 | -0.195 | 0.391 | 0.400 | 0.395 | ||
| NorESM2-LM | [-] | 6.83 | 4.68 | 20.1 | 0.930 | -0.903 | 0.434 | 0.598 | 0.516 | |||
| UKESM1-0-LL | [-] | 11.6 | 11.2 | 20.0 | 0.365 | 0.0699 | -0.441 | 0.363 | 0.289 | 0.326 |
Download Data |
Period Mean (original grids) [Pg] |
Model Period Mean (intersection) [Pg] |
Benchmark Period Mean (intersection) [Pg] |
Model Period Mean (complement) [Pg] |
Benchmark Period Mean (complement) [Pg] |
Bias [kg m-2] |
Bias Score [1] |
Spatial Distribution Score [1] |
Overall Score [1] |
|||
|---|---|---|---|---|---|---|---|---|---|---|---|---|
| Benchmark | [-] | 5.36 | ||||||||||
| ACCESS-ESM1-5 | [-] | 4.49 | 2.13 | 5.36 | 1.59 | 0.00541 | -1.24 | 0.392 | 0.566 | 0.479 | ||
| BCC-CSM2-MR | [-] | 4.74 | 2.24 | 5.36 | 2.37 | 0.00379 | -1.17 | 0.455 | 0.683 | 0.569 | ||
| CanESM5 | [-] | 4.67 | 1.87 | 5.36 | 3.44 | -1.16 | 0.423 | 0.626 | 0.525 | |||
| CESM2 | [-] | 3.21 | 1.74 | 5.36 | 1.30 | 0.00265 | -1.39 | 0.483 | 0.590 | 0.537 | ||
| GFDL-ESM4 | [-] | 3.76 | 1.69 | 5.36 | 1.95 | -1.42 | 0.474 | 0.581 | 0.528 | |||
| IPSL-CM6A-LR | [-] | 3.65 | 1.15 | 5.35 | 2.09 | 0.00866 | -1.64 | 0.411 | 0.558 | 0.485 | ||
| MeanCMIP6 | [-] | 4.71 | 2.04 | 5.36 | 2.24 | -1.23 | 0.484 | 0.671 | 0.578 | |||
| MIROC-ESM2L | [-] | 3.94 | 2.05 | 5.36 | 1.85 | 0.000270 | -1.19 | 0.419 | 0.671 | 0.545 | ||
| NorESM2-LM | [-] | 3.49 | 1.76 | 5.36 | 1.09 | -1.34 | 0.470 | 0.663 | 0.566 | |||
| UKESM1-0-LL | [-] | 4.49 | 2.86 | 5.35 | 2.27 | 0.00942 | -0.804 | 0.384 | 0.382 | 0.383 |
Download Data |
Period Mean (original grids) [Pg] |
Model Period Mean (intersection) [Pg] |
Benchmark Period Mean (intersection) [Pg] |
Model Period Mean (complement) [Pg] |
Benchmark Period Mean (complement) [Pg] |
Bias [kg m-2] |
Bias Score [1] |
Spatial Distribution Score [1] |
Overall Score [1] |
|||
|---|---|---|---|---|---|---|---|---|---|---|---|---|
| Benchmark | [-] | 2.08 | ||||||||||
| ACCESS-ESM1-5 | [-] | 7.92 | 3.43 | 2.01 | 2.09 | 0.0714 | 6.91 | 0.563 | 0.880 | 0.721 | ||
| BCC-CSM2-MR | [-] | 4.06 | 2.19 | 2.07 | 1.59 | 0.00752 | 1.29 | 0.605 | 0.779 | 0.692 | ||
| CanESM5 | [-] | 3.53 | 1.54 | 2.08 | 1.15 | -0.322 | 0.631 | 0.807 | 0.719 | |||
| CESM2 | [-] | 4.64 | 2.35 | 2.05 | 1.67 | 0.0228 | 1.92 | 0.619 | 0.900 | 0.759 | ||
| GFDL-ESM4 | [-] | 4.19 | 1.61 | 2.08 | 2.80 | -1.60 | 0.518 | 0.781 | 0.649 | |||
| IPSL-CM6A-LR | [-] | 2.60 | 1.27 | 2.04 | 0.458 | 0.0396 | -2.43 | 0.584 | 0.745 | 0.665 | ||
| MeanCMIP6 | [-] | 3.96 | 1.87 | 2.08 | 1.34 | 0.490 | 0.647 | 0.712 | 0.679 | |||
| MIROC-ESM2L | [-] | 3.49 | 1.43 | 2.07 | 1.52 | 0.00748 | -1.66 | 0.672 | 0.630 | 0.651 | ||
| NorESM2-LM | [-] | 7.04 | 2.24 | 2.08 | 1.60 | 2.74 | 0.577 | 0.861 | 0.719 | |||
| UKESM1-0-LL | [-] | 3.37 | 2.37 | 2.04 | 1.33 | 0.0326 | 2.71 | 0.630 | 0.717 | 0.673 |
Download Data |
Period Mean (original grids) [Pg] |
Model Period Mean (intersection) [Pg] |
Benchmark Period Mean (intersection) [Pg] |
Model Period Mean (complement) [Pg] |
Benchmark Period Mean (complement) [Pg] |
Bias [kg m-2] |
Bias Score [1] |
Spatial Distribution Score [1] |
Overall Score [1] |
|||
|---|---|---|---|---|---|---|---|---|---|---|---|---|
| Benchmark | [-] | 25.4 | ||||||||||
| ACCESS-ESM1-5 | [-] | 134. | 40.7 | 25.2 | 91.4 | 0.166 | 4.46 | 0.587 | 0.712 | 0.650 | ||
| BCC-CSM2-MR | [-] | 65.9 | 21.8 | 25.1 | 45.1 | 0.293 | -0.448 | 0.659 | 0.898 | 0.778 | ||
| CanESM5 | [-] | 83.3 | 22.3 | 25.4 | 60.6 | 0.375 | 0.647 | 0.877 | 0.762 | |||
| CESM2 | [-] | 64.9 | 21.0 | 25.2 | 43.3 | 0.196 | -0.104 | 0.636 | 0.857 | 0.747 | ||
| GFDL-ESM4 | [-] | 52.8 | 17.1 | 25.4 | 34.8 | -1.95 | 0.559 | 0.793 | 0.676 | |||
| IPSL-CM6A-LR | [-] | 35.8 | 13.6 | 25.3 | 21.8 | 0.0982 | -2.23 | 0.576 | 0.817 | 0.696 | ||
| MeanCMIP6 | [-] | 65.2 | 21.1 | 25.4 | 43.2 | -0.218 | 0.691 | 0.816 | 0.753 | |||
| MIROC-ESM2L | [-] | 75.3 | 17.9 | 25.4 | 56.8 | 0.0143 | -1.18 | 0.590 | 0.848 | 0.719 | ||
| NorESM2-LM | [-] | 58.9 | 21.5 | 25.4 | 41.0 | 0.457 | 0.639 | 0.854 | 0.746 | |||
| UKESM1-0-LL | [-] | 63.2 | 29.8 | 25.1 | 36.5 | 0.241 | 2.16 | 0.703 | 0.860 | 0.781 |
Download Data |
Period Mean (original grids) [Pg] |
Model Period Mean (intersection) [Pg] |
Benchmark Period Mean (intersection) [Pg] |
Model Period Mean (complement) [Pg] |
Benchmark Period Mean (complement) [Pg] |
Bias [kg m-2] |
Bias Score [1] |
Spatial Distribution Score [1] |
Overall Score [1] |
|||
|---|---|---|---|---|---|---|---|---|---|---|---|---|
| Benchmark | [-] | 60.5 | ||||||||||
| ACCESS-ESM1-5 | [-] | 66.7 | 67.5 | 59.9 | 0.0429 | 0.665 | 2.61 | 0.692 | 0.857 | 0.774 | ||
| BCC-CSM2-MR | [-] | 45.2 | 43.9 | 59.9 | 0.0895 | 0.650 | -2.69 | 0.733 | 0.956 | 0.845 | ||
| CanESM5 | [-] | 45.4 | 44.1 | 60.5 | 0.0440 | -0.255 | 0.737 | 0.937 | 0.837 | |||
| CESM2 | [-] | 81.4 | 80.3 | 59.9 | 0.0203 | 0.683 | 6.51 | 0.631 | 0.910 | 0.770 | ||
| GFDL-ESM4 | [-] | 53.7 | 52.2 | 60.5 | 0.174 | -1.68 | 0.597 | 0.689 | 0.643 | |||
| IPSL-CM6A-LR | [-] | 45.4 | 48.2 | 60.1 | 0.0253 | 0.441 | -0.648 | 0.768 | 0.949 | 0.859 | ||
| MeanCMIP6 | [-] | 52.9 | 54.8 | 60.5 | 0.0521 | 0.934 | 0.833 | 0.885 | 0.859 | |||
| MIROC-ESM2L | [-] | 35.7 | 34.9 | 60.5 | 0.456 | 0.0679 | -3.32 | 0.664 | 0.723 | 0.694 | ||
| NorESM2-LM | [-] | 76.8 | 72.0 | 60.5 | 0.0784 | 5.54 | 0.674 | 0.947 | 0.811 | |||
| UKESM1-0-LL | [-] | 59.4 | 60.0 | 60.0 | 0.0455 | 0.590 | 2.50 | 0.811 | 0.795 | 0.803 |
Download Data |
Period Mean (original grids) [Pg] |
Model Period Mean (intersection) [Pg] |
Benchmark Period Mean (intersection) [Pg] |
Model Period Mean (complement) [Pg] |
Benchmark Period Mean (complement) [Pg] |
Bias [kg m-2] |
Bias Score [1] |
Spatial Distribution Score [1] |
Overall Score [1] |
|||
|---|---|---|---|---|---|---|---|---|---|---|---|---|
| Benchmark | [-] | 214. | ||||||||||
| ACCESS-ESM1-5 | [-] | 264. | 260. | 213. | 0.378 | 1.46 | 1.69 | 0.634 | 0.890 | 0.762 | ||
| BCC-CSM2-MR | [-] | 152. | 150. | 213. | 0.392 | 1.51 | -1.52 | 0.655 | 0.895 | 0.775 | ||
| CanESM5 | [-] | 226. | 225. | 214. | 0.554 | 1.45 | 0.583 | 0.858 | 0.721 | |||
| CESM2 | [-] | 202. | 202. | 212. | 0.323 | 2.57 | 0.361 | 0.632 | 0.840 | 0.736 | ||
| GFDL-ESM4 | [-] | 110. | 114. | 214. | 1.15 | -2.80 | 0.519 | 0.821 | 0.670 | |||
| IPSL-CM6A-LR | [-] | 195. | 192. | 213. | 0.427 | 1.50 | 0.0651 | 0.707 | 0.925 | 0.816 | ||
| MeanCMIP6 | [-] | 213. | 212. | 214. | 0.378 | 0.759 | 0.722 | 0.926 | 0.824 | |||
| MIROC-ESM2L | [-] | 237. | 232. | 214. | 1.33 | 0.747 | 1.47 | 0.643 | 0.860 | 0.752 | ||
| NorESM2-LM | [-] | 194. | 194. | 214. | 0.423 | 0.503 | 0.627 | 0.848 | 0.737 | |||
| UKESM1-0-LL | [-] | 292. | 283. | 213. | 0.473 | 1.64 | 3.09 | 0.624 | 0.891 | 0.757 |
Download Data |
Period Mean (original grids) [Pg] |
Model Period Mean (intersection) [Pg] |
Benchmark Period Mean (intersection) [Pg] |
Model Period Mean (complement) [Pg] |
Benchmark Period Mean (complement) [Pg] |
Bias [kg m-2] |
Bias Score [1] |
Spatial Distribution Score [1] |
Overall Score [1] |
|||
|---|---|---|---|---|---|---|---|---|---|---|---|---|
| Benchmark | [-] | 0.801 | ||||||||||
| ACCESS-ESM1-5 | [-] | 17.3 | 0.0664 | 0.801 | 17.8 | -3.59 | 0.399 | 0.660 | 0.529 | |||
| BCC-CSM2-MR | [-] | 14.3 | 0.120 | 0.801 | 14.5 | -3.31 | 0.430 | 0.822 | 0.626 | |||
| CanESM5 | [-] | 11.9 | 0.0125 | 0.801 | 12.3 | -3.86 | 0.374 | 0.0148 | 0.194 | |||
| CESM2 | [-] | 21.5 | 0.236 | 0.801 | 21.5 | -2.76 | 0.503 | 0.915 | 0.709 | |||
| GFDL-ESM4 | [-] | 57.8 | 0.435 | 0.801 | 57.7 | -1.82 | 0.566 | 0.436 | 0.501 | |||
| IPSL-CM6A-LR | [-] | 5.60 | 0.00225 | 0.801 | 5.70 | -3.92 | 0.372 | 0.228 | 0.300 | |||
| MeanCMIP6 | [-] | 12.9 | 0.144 | 0.801 | 13.5 | -3.23 | 0.445 | 0.753 | 0.599 | |||
| MIROC-ESM2L | [-] | 14.6 | 0.0901 | 0.801 | 14.9 | -3.50 | 0.418 | 0.675 | 0.547 | |||
| NorESM2-LM | [-] | 13.4 | 0.200 | 0.801 | 14.4 | -2.93 | 0.482 | 0.830 | 0.656 | |||
| UKESM1-0-LL | [-] | 9.82 | 0.323 | 0.801 | 9.38 | -2.35 | 0.488 | 0.347 | 0.418 |
Download Data |
Period Mean (original grids) [Pg] |
Model Period Mean (intersection) [Pg] |
Benchmark Period Mean (intersection) [Pg] |
Model Period Mean (complement) [Pg] |
Benchmark Period Mean (complement) [Pg] |
Bias [kg m-2] |
Bias Score [1] |
Spatial Distribution Score [1] |
Overall Score [1] |
|||
|---|---|---|---|---|---|---|---|---|---|---|---|---|
| Benchmark | [-] | 16.7 | ||||||||||
| ACCESS-ESM1-5 | [-] | 58.8 | 28.1 | 16.6 | 31.1 | 0.0400 | 2.23 | 0.456 | 0.358 | 0.407 | ||
| BCC-CSM2-MR | [-] | 28.6 | 12.6 | 16.6 | 15.3 | 0.0388 | -0.722 | 0.600 | 0.857 | 0.728 | ||
| CanESM5 | [-] | 35.2 | 16.3 | 16.7 | 19.3 | 0.154 | 0.566 | 0.718 | 0.642 | |||
| CESM2 | [-] | 20.2 | 11.0 | 16.7 | 8.90 | 0.0266 | -0.978 | 0.567 | 0.786 | 0.677 | ||
| GFDL-ESM4 | [-] | 20.2 | 8.04 | 16.7 | 11.4 | -1.58 | 0.518 | 0.812 | 0.665 | |||
| IPSL-CM6A-LR | [-] | 21.8 | 9.28 | 16.6 | 11.5 | 0.0409 | -1.25 | 0.516 | 0.791 | 0.653 | ||
| MeanCMIP6 | [-] | 30.9 | 14.2 | 16.7 | 16.2 | -0.335 | 0.622 | 0.876 | 0.749 | |||
| MIROC-ESM2L | [-] | 48.8 | 19.3 | 16.7 | 32.6 | 0.0128 | 0.616 | 0.543 | 0.656 | 0.599 | ||
| NorESM2-LM | [-] | 24.1 | 13.1 | 16.7 | 8.83 | -0.523 | 0.568 | 0.710 | 0.639 | |||
| UKESM1-0-LL | [-] | 35.8 | 17.6 | 16.6 | 15.9 | 0.0369 | 0.390 | 0.543 | 0.635 | 0.589 |
Temporally integrated period mean