Mean State
Download Data |
Period Mean (original grids) [Pg] |
Model Period Mean (intersection) [Pg] |
Benchmark Period Mean (intersection) [Pg] |
Model Period Mean (complement) [Pg] |
Benchmark Period Mean (complement) [Pg] |
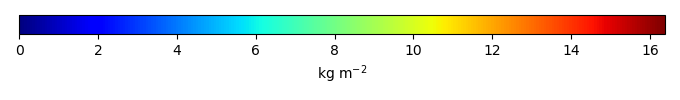
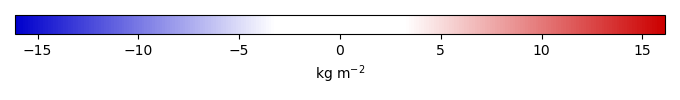
Bias [kg m-2] |
Bias Score [1] |
Spatial Distribution Score [1] |
Overall Score [1] |
|||
|---|---|---|---|---|---|---|---|---|---|---|---|---|
| Benchmark | [-] | 1.62 | ||||||||||
| ACCESS-ESM1-5 | [-] | 91.1 | 2.29 | 1.62 | 90.4 | 0.00158 | 0.805 | 0.613 | 0.880 | 0.746 | ||
| BCC-CSM2-MR | [-] | 56.2 | 1.38 | 1.62 | 54.3 | 0.00630 | -0.174 | 0.570 | 0.794 | 0.682 | ||
| CanESM5 | [-] | 56.6 | 0.455 | 1.62 | 52.6 | -1.14 | 0.465 | 0.555 | 0.510 | |||
| CESM2 | [-] | 73.9 | 3.55 | 1.62 | 69.7 | 0.00637 | 2.23 | 0.421 | 0.769 | 0.595 | ||
| GFDL-ESM4 | [-] | 65.6 | 5.27 | 1.62 | 61.2 | 3.81 | 0.349 | 0.807 | 0.578 | |||
| IPSL-CM6A-LR | [-] | 21.0 | 1.35 | 1.62 | 19.6 | 0.00532 | -0.232 | 0.536 | 0.708 | 0.622 | ||
| MeanCMIP6 | [-] | 52.1 | 2.02 | 1.62 | 51.6 | 0.596 | 0.630 | 0.571 | 0.601 | |||
| MIROC-ESM2L | [-] | 57.1 | 1.58 | 1.62 | 52.1 | 0.0141 | 0.586 | 0.796 | 0.691 | |||
| NorESM2-LM | [-] | 66.1 | 2.69 | 1.62 | 61.1 | 1.53 | 0.499 | 0.840 | 0.669 | |||
| UKESM1-0-LL | [-] | 58.0 | 3.01 | 1.62 | 53.4 | 1.88 | 0.542 | 0.772 | 0.657 |
Download Data |
Period Mean (original grids) [Pg] |
Model Period Mean (intersection) [Pg] |
Benchmark Period Mean (intersection) [Pg] |
Model Period Mean (complement) [Pg] |
Benchmark Period Mean (complement) [Pg] |
Bias [kg m-2] |
Bias Score [1] |
Spatial Distribution Score [1] |
Overall Score [1] |
|||
|---|---|---|---|---|---|---|---|---|---|---|---|---|
| Benchmark | [-] | 30.1 | ||||||||||
| ACCESS-ESM1-5 | [-] | 662. | 37.8 | 30.0 | 624. | 0.0950 | 1.04 | 0.620 | 0.886 | 0.753 | ||
| BCC-CSM2-MR | [-] | 386. | 22.0 | 29.9 | 363. | 0.201 | -0.738 | 0.614 | 0.695 | 0.654 | ||
| CanESM5 | [-] | 509. | 33.0 | 30.1 | 467. | 0.805 | 0.606 | 0.849 | 0.728 | |||
| CESM2 | [-] | 485. | 16.4 | 29.9 | 467. | 0.176 | -1.18 | 0.538 | 0.678 | 0.608 | ||
| GFDL-ESM4 | [-] | 405. | 20.5 | 30.1 | 385. | -1.05 | 0.508 | 0.507 | 0.508 | |||
| IPSL-CM6A-LR | [-] | 350. | 17.9 | 29.8 | 330. | 0.329 | -1.12 | 0.565 | 0.374 | 0.470 | ||
| MeanCMIP6 | [-] | 460. | 23.7 | 30.1 | 436. | -0.344 | 0.635 | 0.581 | 0.608 | |||
| MIROC-ESM2L | [-] | 520. | 35.2 | 30.1 | 474. | 0.000179 | 0.975 | 0.588 | 0.830 | 0.709 | ||
| NorESM2-LM | [-] | 463. | 15.0 | 30.1 | 442. | -1.16 | 0.539 | 0.658 | 0.598 | |||
| UKESM1-0-LL | [-] | 545. | 26.5 | 29.8 | 516. | 0.329 | 0.120 | 0.604 | 0.711 | 0.658 |
Download Data |
Period Mean (original grids) [Pg] |
Model Period Mean (intersection) [Pg] |
Benchmark Period Mean (intersection) [Pg] |
Model Period Mean (complement) [Pg] |
Benchmark Period Mean (complement) [Pg] |
Bias [kg m-2] |
Bias Score [1] |
Spatial Distribution Score [1] |
Overall Score [1] |
|||
|---|---|---|---|---|---|---|---|---|---|---|---|---|
| Benchmark | [-] | 0.0236 | ||||||||||
| ACCESS-ESM1-5 | [-] | 15.6 | 0.336 | 0.0236 | 15.6 | 0.863 | 0.407 | 0.109 | 0.258 | |||
| BCC-CSM2-MR | [-] | 10.6 | 0.220 | 0.0236 | 11.1 | 0.548 | 0.428 | 0.607 | 0.518 | |||
| CanESM5 | [-] | 24.1 | 0.794 | 0.0236 | 22.4 | 2.14 | 0.308 | 0.215 | 0.261 | |||
| CESM2 | [-] | 6.23 | 0.0768 | 0.0236 | 5.64 | 0.171 | 0.473 | 0.555 | 0.514 | |||
| GFDL-ESM4 | [-] | 2.90 | 0.119 | 0.0236 | 2.79 | 0.257 | 0.484 | 0.632 | 0.558 | |||
| IPSL-CM6A-LR | [-] | 15.8 | 0.442 | 0.0236 | 12.2 | 1.13 | 0.395 | 0.197 | 0.296 | |||
| MeanCMIP6 | [-] | 12.7 | 0.253 | 0.0236 | 12.1 | 0.643 | 0.352 | 0.547 | 0.449 | |||
| MIROC-ESM2L | [-] | 17.3 | 0.158 | 0.0236 | 16.7 | 0.359 | 0.411 | 0.0552 | 0.233 | |||
| NorESM2-LM | [-] | 6.82 | 0.0766 | 0.0236 | 5.52 | 0.177 | 0.475 | 0.515 | 0.495 | |||
| UKESM1-0-LL | [-] | 11.6 | 0.0270 | 0.0236 | 11.6 | 9.46e-07 | 0.00934 | 0.410 | 0.597 | 0.504 |
Download Data |
Period Mean (original grids) [Pg] |
Model Period Mean (intersection) [Pg] |
Benchmark Period Mean (intersection) [Pg] |
Model Period Mean (complement) [Pg] |
Benchmark Period Mean (complement) [Pg] |
Bias [kg m-2] |
Bias Score [1] |
Spatial Distribution Score [1] |
Overall Score [1] |
|||
|---|---|---|---|---|---|---|---|---|---|---|---|---|
| Benchmark | [-] | 0.897 | ||||||||||
| ACCESS-ESM1-5 | [-] | 4.50 | 0.775 | 0.897 | 2.96 | -0.0453 | 0.486 | 0.534 | 0.510 | |||
| BCC-CSM2-MR | [-] | 4.74 | 0.940 | 0.895 | 3.69 | 0.00164 | 0.0479 | 0.494 | 0.155 | 0.324 | ||
| CanESM5 | [-] | 4.68 | 1.63 | 0.897 | 3.69 | 0.776 | 0.500 | 0.278 | 0.389 | |||
| CESM2 | [-] | 3.22 | 0.276 | 0.896 | 2.78 | 0.00112 | -0.549 | 0.433 | 0.135 | 0.284 | ||
| GFDL-ESM4 | [-] | 3.75 | 0.708 | 0.897 | 2.92 | -0.148 | 0.478 | 0.105 | 0.291 | |||
| IPSL-CM6A-LR | [-] | 3.65 | 1.69 | 0.896 | 1.56 | 0.00104 | 0.840 | 0.484 | 0.386 | 0.435 | ||
| MeanCMIP6 | [-] | 4.72 | 0.858 | 0.897 | 3.42 | 0.00381 | 0.500 | 0.104 | 0.302 | |||
| MIROC-ESM2L | [-] | 3.94 | 0.519 | 0.897 | 3.38 | -0.355 | 0.411 | 0.472 | 0.442 | |||
| NorESM2-LM | [-] | 3.50 | 0.187 | 0.897 | 2.67 | -0.690 | 0.420 | 0.0414 | 0.231 | |||
| UKESM1-0-LL | [-] | 4.50 | 0.850 | 0.897 | 4.29 | 1.11e-05 | 0.0455 | 0.413 | 0.592 | 0.502 |
Download Data |
Period Mean (original grids) [Pg] |
Model Period Mean (intersection) [Pg] |
Benchmark Period Mean (intersection) [Pg] |
Model Period Mean (complement) [Pg] |
Benchmark Period Mean (complement) [Pg] |
Bias [kg m-2] |
Bias Score [1] |
Spatial Distribution Score [1] |
Overall Score [1] |
|||
|---|---|---|---|---|---|---|---|---|---|---|---|---|
| Benchmark | [-] | 0.914 | ||||||||||
| ACCESS-ESM1-5 | [-] | 7.93 | 0.397 | 0.857 | 5.13 | 0.0578 | -4.00 | 0.605 | 0.614 | 0.609 | ||
| BCC-CSM2-MR | [-] | 4.07 | 0.385 | 0.908 | 3.40 | 0.00625 | -4.48 | 0.560 | 0.789 | 0.674 | ||
| CanESM5 | [-] | 3.54 | 0.168 | 0.914 | 2.52 | -4.60 | 0.553 | 0.723 | 0.638 | |||
| CESM2 | [-] | 4.64 | 0.427 | 0.851 | 3.59 | 0.0639 | -1.41 | 0.647 | 0.763 | 0.705 | ||
| GFDL-ESM4 | [-] | 4.20 | 0.636 | 0.914 | 3.78 | -2.76 | 0.596 | 0.355 | 0.475 | |||
| IPSL-CM6A-LR | [-] | 2.61 | 0.0670 | 0.848 | 1.67 | 0.0665 | -8.26 | 0.457 | 0.203 | 0.330 | ||
| MeanCMIP6 | [-] | 3.96 | 0.292 | 0.914 | 2.93 | -4.21 | 0.594 | 0.400 | 0.497 | |||
| MIROC-ESM2L | [-] | 3.50 | 0.492 | 0.914 | 2.47 | -3.07 | 0.559 | 0.800 | 0.680 | |||
| NorESM2-LM | [-] | 7.04 | 0.360 | 0.914 | 3.48 | -1.57 | 0.610 | 0.671 | 0.640 | |||
| UKESM1-0-LL | [-] | 3.37 | 0.274 | 0.816 | 3.42 | 0.0983 | -3.50 | 0.600 | 0.0341 | 0.317 |
Download Data |
Period Mean (original grids) [Pg] |
Model Period Mean (intersection) [Pg] |
Benchmark Period Mean (intersection) [Pg] |
Model Period Mean (complement) [Pg] |
Benchmark Period Mean (complement) [Pg] |
Bias [kg m-2] |
Bias Score [1] |
Spatial Distribution Score [1] |
Overall Score [1] |
|||
|---|---|---|---|---|---|---|---|---|---|---|---|---|
| Benchmark | [-] | 20.0 | ||||||||||
| ACCESS-ESM1-5 | [-] | 134. | 25.1 | 20.0 | 107. | 0.0387 | 1.72 | 0.636 | 0.896 | 0.766 | ||
| BCC-CSM2-MR | [-] | 66.1 | 13.5 | 19.8 | 53.5 | 0.201 | -1.56 | 0.633 | 0.722 | 0.677 | ||
| CanESM5 | [-] | 83.4 | 22.9 | 20.0 | 60.2 | 1.52 | 0.642 | 0.856 | 0.749 | |||
| CESM2 | [-] | 65.0 | 9.28 | 19.9 | 55.1 | 0.104 | -2.62 | 0.574 | 0.689 | 0.632 | ||
| GFDL-ESM4 | [-] | 52.9 | 9.75 | 20.0 | 42.2 | -2.90 | 0.533 | 0.317 | 0.425 | |||
| IPSL-CM6A-LR | [-] | 35.9 | 8.73 | 19.8 | 26.7 | 0.215 | -2.91 | 0.568 | 0.345 | 0.457 | ||
| MeanCMIP6 | [-] | 65.3 | 14.0 | 20.0 | 50.4 | -1.21 | 0.658 | 0.521 | 0.590 | |||
| MIROC-ESM2L | [-] | 75.4 | 21.6 | 20.0 | 53.3 | 0.000169 | 0.875 | 0.620 | 0.817 | 0.719 | ||
| NorESM2-LM | [-] | 59.0 | 9.34 | 20.0 | 53.3 | -2.23 | 0.578 | 0.688 | 0.633 | |||
| UKESM1-0-LL | [-] | 63.2 | 12.7 | 19.8 | 53.6 | 0.232 | -1.63 | 0.630 | 0.620 | 0.625 |
Download Data |
Period Mean (original grids) [Pg] |
Model Period Mean (intersection) [Pg] |
Benchmark Period Mean (intersection) [Pg] |
Model Period Mean (complement) [Pg] |
Benchmark Period Mean (complement) [Pg] |
Bias [kg m-2] |
Bias Score [1] |
Spatial Distribution Score [1] |
Overall Score [1] |
|||
|---|---|---|---|---|---|---|---|---|---|---|---|---|
| Benchmark | [-] | 2.13 | ||||||||||
| ACCESS-ESM1-5 | [-] | 264. | 2.63 | 2.13 | 258. | 0.000922 | 1.23 | 0.659 | 0.873 | 0.766 | ||
| BCC-CSM2-MR | [-] | 152. | 2.41 | 2.13 | 148. | 4.88e-05 | 0.665 | 0.699 | 0.899 | 0.799 | ||
| CanESM5 | [-] | 226. | 3.16 | 2.13 | 222. | 3.53 | 0.611 | 0.883 | 0.747 | |||
| CESM2 | [-] | 202. | 1.01 | 2.12 | 201. | 0.00749 | -1.01 | 0.554 | 0.823 | 0.689 | ||
| GFDL-ESM4 | [-] | 110. | 0.299 | 2.13 | 114. | -2.61 | 0.413 | 0.0175 | 0.215 | |||
| IPSL-CM6A-LR | [-] | 195. | 1.84 | 2.09 | 191. | 0.0360 | 0.367 | 0.692 | 0.739 | 0.716 | ||
| MeanCMIP6 | [-] | 213. | 2.41 | 2.13 | 210. | 1.63 | 0.720 | 0.841 | 0.780 | |||
| MIROC-ESM2L | [-] | 238. | 4.04 | 2.13 | 230. | 4.89 | 0.593 | 0.855 | 0.724 | |||
| NorESM2-LM | [-] | 194. | 0.876 | 2.13 | 194. | -0.869 | 0.536 | 0.798 | 0.667 | |||
| UKESM1-0-LL | [-] | 291. | 3.18 | 2.13 | 281. | 0.00155 | 4.11 | 0.557 | 0.732 | 0.644 |
Download Data |
Period Mean (original grids) [Pg] |
Model Period Mean (intersection) [Pg] |
Benchmark Period Mean (intersection) [Pg] |
Model Period Mean (complement) [Pg] |
Benchmark Period Mean (complement) [Pg] |
Bias [kg m-2] |
Bias Score [1] |
Spatial Distribution Score [1] |
Overall Score [1] |
|||
|---|---|---|---|---|---|---|---|---|---|---|---|---|
| Benchmark | [-] | 0.137 | ||||||||||
| ACCESS-ESM1-5 | [-] | 17.4 | 0.407 | 0.137 | 17.5 | 1.01 | 0.389 | 0.483 | 0.436 | |||
| BCC-CSM2-MR | [-] | 14.3 | 0.307 | 0.137 | 14.3 | 0.674 | 0.513 | 0.689 | 0.601 | |||
| CanESM5 | [-] | 11.9 | 0.0851 | 0.137 | 12.3 | -0.217 | 0.508 | 0.145 | 0.327 | |||
| CESM2 | [-] | 21.5 | 1.02 | 0.137 | 20.8 | 3.33 | 0.0997 | 0.256 | 0.178 | |||
| GFDL-ESM4 | [-] | 57.9 | 1.39 | 0.137 | 56.8 | 4.74 | 0.0575 | 0.659 | 0.358 | |||
| IPSL-CM6A-LR | [-] | 5.63 | 0.354 | 0.137 | 5.38 | 0.892 | 0.426 | 0.514 | 0.470 | |||
| MeanCMIP6 | [-] | 13.0 | 0.482 | 0.137 | 13.2 | 1.32 | 0.359 | 0.834 | 0.597 | |||
| MIROC-ESM2L | [-] | 14.7 | 0.367 | 0.137 | 14.7 | 0.809 | 0.537 | 0.808 | 0.673 | |||
| NorESM2-LM | [-] | 13.5 | 0.907 | 0.137 | 13.7 | 3.01 | 0.152 | 0.466 | 0.309 | |||
| UKESM1-0-LL | [-] | 9.87 | 0.259 | 0.137 | 9.50 | 0.471 | 0.620 | 0.716 | 0.668 |
Download Data |
Period Mean (original grids) [Pg] |
Model Period Mean (intersection) [Pg] |
Benchmark Period Mean (intersection) [Pg] |
Model Period Mean (complement) [Pg] |
Benchmark Period Mean (complement) [Pg] |
Bias [kg m-2] |
Bias Score [1] |
Spatial Distribution Score [1] |
Overall Score [1] |
|||
|---|---|---|---|---|---|---|---|---|---|---|---|---|
| Benchmark | [-] | 4.36 | ||||||||||
| ACCESS-ESM1-5 | [-] | 58.8 | 5.73 | 4.36 | 53.5 | 0.672 | 0.566 | 0.846 | 0.706 | |||
| BCC-CSM2-MR | [-] | 28.6 | 2.77 | 4.36 | 25.3 | 0.000926 | -0.761 | 0.543 | 0.368 | 0.456 | ||
| CanESM5 | [-] | 35.2 | 3.77 | 4.36 | 31.8 | -0.312 | 0.532 | 0.555 | 0.544 | |||
| CESM2 | [-] | 20.3 | 0.692 | 4.36 | 19.2 | 0.00445 | -1.55 | 0.419 | 0.0776 | 0.248 | ||
| GFDL-ESM4 | [-] | 20.2 | 2.30 | 4.36 | 17.1 | -0.899 | 0.500 | 0.320 | 0.410 | |||
| IPSL-CM6A-LR | [-] | 21.9 | 3.36 | 4.35 | 17.5 | 0.00709 | -0.448 | 0.545 | 0.337 | 0.441 | ||
| MeanCMIP6 | [-] | 30.9 | 3.30 | 4.36 | 27.1 | -0.423 | 0.538 | 0.291 | 0.414 | |||
| MIROC-ESM2L | [-] | 48.9 | 6.42 | 4.36 | 45.5 | 1.09 | 0.487 | 0.743 | 0.615 | |||
| NorESM2-LM | [-] | 24.2 | 0.519 | 4.36 | 21.5 | -1.67 | 0.401 | 0.0630 | 0.232 | |||
| UKESM1-0-LL | [-] | 35.8 | 6.09 | 4.36 | 27.5 | 0.00345 | 0.822 | 0.577 | 0.664 | 0.620 |
Temporally integrated period mean