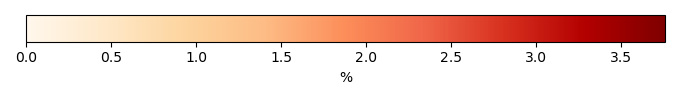
Mean State
Download Data |
Period Mean (original grids) [%] |
Model Period Mean (intersection) [%] |
Benchmark Period Mean (intersection) [%] |
Model Period Mean (complement) [%] |
Benchmark Period Mean (complement) [%] |
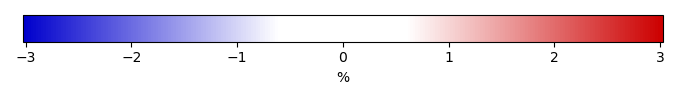
Bias [%] |
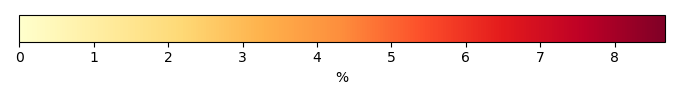
RMSE [%] |
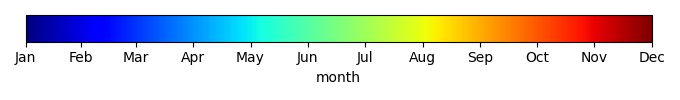
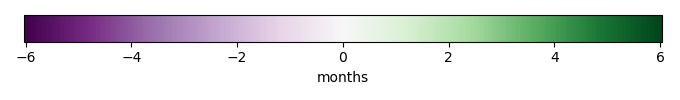
Phase Shift [months] |
Bias Score [1] |
RMSE Score [1] |
Seasonal Cycle Score [1] |
Spatial Distribution Score [1] |
Overall Score [1] |
|||
|---|---|---|---|---|---|---|---|---|---|---|---|---|---|---|---|---|
| Benchmark | [-] | 0.0483 | ||||||||||||||
| CESM2 | [-] | 0.0328 | 0.0341 | 0.0485 | 0.00148 | 0.00218 | -0.0153 | 0.148 | 2.30 | 0.838 | 0.679 | 0.738 | 0.600 | 0.707 | ||
| NorESM2-LM | [-] | 0.0299 | 0.0265 | 0.0483 | 0.00427 | -0.0245 | 0.140 | 2.28 | 0.838 | 0.688 | 0.782 | 0.548 | 0.709 |
Download Data |
Period Mean (original grids) [%] |
Model Period Mean (intersection) [%] |
Benchmark Period Mean (intersection) [%] |
Model Period Mean (complement) [%] |
Benchmark Period Mean (complement) [%] |
Bias [%] |
RMSE [%] |
Phase Shift [months] |
Bias Score [1] |
RMSE Score [1] |
Seasonal Cycle Score [1] |
Spatial Distribution Score [1] |
Overall Score [1] |
|||
|---|---|---|---|---|---|---|---|---|---|---|---|---|---|---|---|---|
| Benchmark | [-] | 0.325 | ||||||||||||||
| CESM2 | [-] | 0.284 | 0.329 | 0.328 | 0.0166 | 0.0519 | -0.0108 | 0.836 | 2.04 | 0.723 | 0.446 | 0.726 | 0.746 | 0.617 | ||
| NorESM2-LM | [-] | 0.210 | 0.266 | 0.325 | 0.0177 | -0.0744 | 0.748 | 2.07 | 0.726 | 0.465 | 0.719 | 0.655 | 0.606 |
Download Data |
Period Mean (original grids) [%] |
Model Period Mean (intersection) [%] |
Benchmark Period Mean (intersection) [%] |
Model Period Mean (complement) [%] |
Benchmark Period Mean (complement) [%] |
Bias [%] |
RMSE [%] |
Phase Shift [months] |
Bias Score [1] |
RMSE Score [1] |
Seasonal Cycle Score [1] |
Spatial Distribution Score [1] |
Overall Score [1] |
|||
|---|---|---|---|---|---|---|---|---|---|---|---|---|---|---|---|---|
| Benchmark | [-] | 0.324 | ||||||||||||||
| CESM2 | [-] | 0.264 | 0.433 | 0.328 | 0.00154 | 0.0247 | 0.0946 | 0.799 | 2.19 | 0.787 | 0.569 | 0.769 | 0.801 | 0.699 | ||
| NorESM2-LM | [-] | 0.237 | 0.368 | 0.324 | 0.00282 | 0.0238 | 0.752 | 2.27 | 0.782 | 0.572 | 0.736 | 0.758 | 0.684 |
Download Data |
Period Mean (original grids) [%] |
Model Period Mean (intersection) [%] |
Benchmark Period Mean (intersection) [%] |
Model Period Mean (complement) [%] |
Benchmark Period Mean (complement) [%] |
Bias [%] |
RMSE [%] |
Phase Shift [months] |
Bias Score [1] |
RMSE Score [1] |
Seasonal Cycle Score [1] |
Spatial Distribution Score [1] |
Overall Score [1] |
|||
|---|---|---|---|---|---|---|---|---|---|---|---|---|---|---|---|---|
| Benchmark | [-] | 0.0620 | ||||||||||||||
| CESM2 | [-] | 0.0692 | 0.0800 | 0.0621 | 0.00413 | 0.0186 | 0.0181 | 0.214 | 2.68 | 0.774 | 0.644 | 0.677 | 0.543 | 0.657 | ||
| NorESM2-LM | [-] | 0.0542 | 0.0717 | 0.0620 | 0.00662 | 0.0125 | 0.211 | 2.59 | 0.777 | 0.644 | 0.700 | 0.562 | 0.666 |
Download Data |
Period Mean (original grids) [%] |
Model Period Mean (intersection) [%] |
Benchmark Period Mean (intersection) [%] |
Model Period Mean (complement) [%] |
Benchmark Period Mean (complement) [%] |
Bias [%] |
RMSE [%] |
Phase Shift [months] |
Bias Score [1] |
RMSE Score [1] |
Seasonal Cycle Score [1] |
Spatial Distribution Score [1] |
Overall Score [1] |
|||
|---|---|---|---|---|---|---|---|---|---|---|---|---|---|---|---|---|
| Benchmark | [-] | 0.0123 | ||||||||||||||
| CESM2 | [-] | 0.0101 | 0.0190 | 0.0134 | 6.00e-05 | 0.000479 | 0.00201 | 0.0435 | 2.47 | 0.726 | 0.558 | 0.739 | 0.304 | 0.577 | ||
| NorESM2-LM | [-] | 0.0182 | 0.0312 | 0.0123 | 0.000316 | 0.0108 | 0.0547 | 2.41 | 0.702 | 0.512 | 0.681 | 0.309 | 0.543 |
Download Data |
Period Mean (original grids) [%] |
Model Period Mean (intersection) [%] |
Benchmark Period Mean (intersection) [%] |
Model Period Mean (complement) [%] |
Benchmark Period Mean (complement) [%] |
Bias [%] |
RMSE [%] |
Phase Shift [months] |
Bias Score [1] |
RMSE Score [1] |
Seasonal Cycle Score [1] |
Spatial Distribution Score [1] |
Overall Score [1] |
|||
|---|---|---|---|---|---|---|---|---|---|---|---|---|---|---|---|---|
| Benchmark | [-] | 0.0451 | ||||||||||||||
| CESM2 | [-] | 0.0960 | 0.0895 | 0.0455 | 0.0102 | 0.00788 | 0.0416 | 0.193 | 2.38 | 0.729 | 0.531 | 0.714 | 0.285 | 0.558 | ||
| NorESM2-LM | [-] | 0.0892 | 0.0768 | 0.0451 | 0.0317 | 0.0281 | 0.171 | 2.29 | 0.744 | 0.553 | 0.730 | 0.416 | 0.599 |
Download Data |
Period Mean (original grids) [%] |
Model Period Mean (intersection) [%] |
Benchmark Period Mean (intersection) [%] |
Model Period Mean (complement) [%] |
Benchmark Period Mean (complement) [%] |
Bias [%] |
RMSE [%] |
Phase Shift [months] |
Bias Score [1] |
RMSE Score [1] |
Seasonal Cycle Score [1] |
Spatial Distribution Score [1] |
Overall Score [1] |
|||
|---|---|---|---|---|---|---|---|---|---|---|---|---|---|---|---|---|
| Benchmark | [-] | 0.0525 | ||||||||||||||
| CESM2 | [-] | 0.0490 | 0.0443 | 0.0548 | 0.0570 | 0.0108 | -0.00746 | 0.139 | 1.75 | 0.726 | 0.532 | 0.885 | 0.566 | 0.648 | ||
| NorESM2-LM | [-] | 0.0550 | 0.0501 | 0.0525 | 0.0783 | 0.00139 | 0.147 | 1.84 | 0.720 | 0.535 | 0.843 | 0.500 | 0.627 |
Download Data |
Period Mean (original grids) [%] |
Model Period Mean (intersection) [%] |
Benchmark Period Mean (intersection) [%] |
Model Period Mean (complement) [%] |
Benchmark Period Mean (complement) [%] |
Bias [%] |
RMSE [%] |
Phase Shift [months] |
Bias Score [1] |
RMSE Score [1] |
Seasonal Cycle Score [1] |
Spatial Distribution Score [1] |
Overall Score [1] |
|||
|---|---|---|---|---|---|---|---|---|---|---|---|---|---|---|---|---|
| Benchmark | [-] | 0.837 | ||||||||||||||
| CESM2 | [-] | 0.764 | 0.760 | 0.860 | 0.154 | 0.0585 | -0.148 | 2.07 | 1.60 | 0.705 | 0.399 | 0.712 | 0.730 | 0.589 | ||
| NorESM2-LM | [-] | 0.579 | 0.590 | 0.837 | 0.190 | -0.307 | 1.78 | 1.68 | 0.709 | 0.423 | 0.709 | 0.620 | 0.577 |
Download Data |
Period Mean (original grids) [%] |
Model Period Mean (intersection) [%] |
Benchmark Period Mean (intersection) [%] |
Model Period Mean (complement) [%] |
Benchmark Period Mean (complement) [%] |
Bias [%] |
RMSE [%] |
Phase Shift [months] |
Bias Score [1] |
RMSE Score [1] |
Seasonal Cycle Score [1] |
Spatial Distribution Score [1] |
Overall Score [1] |
|||
|---|---|---|---|---|---|---|---|---|---|---|---|---|---|---|---|---|
| Benchmark | [-] | 0.0182 | ||||||||||||||
| CESM2 | [-] | 0.00563 | 0.00685 | 0.0184 | 8.35e-06 | 0.000416 | -0.0115 | 0.0535 | 2.15 | 0.886 | 0.758 | 0.829 | 0.581 | 0.762 | ||
| NorESM2-LM | [-] | 0.00172 | 0.00293 | 0.0182 | 8.88e-05 | -0.0159 | 0.0488 | 2.30 | 0.882 | 0.760 | 0.782 | 0.415 | 0.720 |
Download Data |
Period Mean (original grids) [%] |
Model Period Mean (intersection) [%] |
Benchmark Period Mean (intersection) [%] |
Model Period Mean (complement) [%] |
Benchmark Period Mean (complement) [%] |
Bias [%] |
RMSE [%] |
Phase Shift [months] |
Bias Score [1] |
RMSE Score [1] |
Seasonal Cycle Score [1] |
Spatial Distribution Score [1] |
Overall Score [1] |
|||
|---|---|---|---|---|---|---|---|---|---|---|---|---|---|---|---|---|
| Benchmark | [-] | 0.120 | ||||||||||||||
| CESM2 | [-] | 0.208 | 0.219 | 0.121 | 0.0930 | 0.0193 | 0.0995 | 0.490 | 1.96 | 0.722 | 0.562 | 0.771 | 0.561 | 0.635 | ||
| NorESM2-LM | [-] | 0.167 | 0.183 | 0.120 | 0.109 | 0.0796 | 0.446 | 2.01 | 0.727 | 0.572 | 0.777 | 0.609 | 0.651 |
Temporally integrated period mean