Mean State
Download Data |
Period Mean (original grids) [Pg] |
Model Period Mean (intersection) [Pg] |
Model Period Mean (complement) [Pg] |
Benchmark Period Mean (intersection) [Pg] |
Benchmark Period Mean (complement) [Pg] |
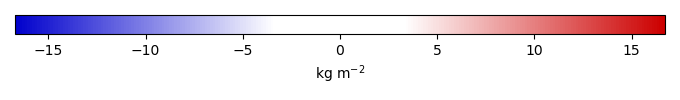
Bias [kg m-2] |
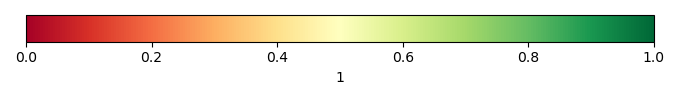
Bias Score [1] |
Spatial Distribution Score [1] |
Overall Score [1] |
|||
|---|---|---|---|---|---|---|---|---|---|---|---|---|
| Benchmark | [-] | 0.797 | ||||||||||
| bcc-csm1-1 | [-] | 13.5 | 1.30 | 11.8 | 0.793 | 1.70 | 0.619 | 0.764 | 0.691 | |||
| bcc-csm1-1-m | [-] | 9.37 | 0.771 | 8.61 | 0.630 | 0.000376 | 0.431 | 0.591 | 0.685 | 0.638 | ||
| CESM1-BGC | [-] | 8.85 | 0.656 | 8.18 | 0.538 | 0.0190 | 1.09 | 0.580 | 0.796 | 0.688 | ||
| E3SMv1-CTC | [-] | 6.94 | 0.994 | 6.42 | 0.797 | 5.49e-05 | 1.24 | 0.623 | 0.803 | 0.713 | ||
| E3SMv1-ECA | [-] | 6.55 | 1.03 | 5.84 | 0.797 | 5.49e-05 | 1.34 | 0.530 | 0.766 | 0.648 | ||
| GFDL-ESM2G | [-] | 16.9 | 1.49 | 15.4 | 0.683 | 3.32 | 0.493 | 0.735 | 0.614 | |||
| inmcm4 | [-] | 16.4 | 4.04 | 14.3 | 0.650 | 0.147 | 7.79 | 0.130 | 0.210 | 0.170 | ||
| IPSL-CM5A-LR | [-] | 5.47 | 1.10 | 4.29 | 0.644 | 0.0240 | 2.86 | 0.360 | 0.465 | 0.413 | ||
| MeanCMIP5 | [-] | 9.38 | 1.39 | 8.56 | 0.797 | 2.12 | 0.545 | 0.857 | 0.701 | |||
| MIROC-ESM | [-] | 4.39 | 0.896 | 3.00 | 0.467 | 0.326 | 1.02 | 0.450 | 0.649 | 0.549 | ||
| MPI-ESM-LR | [-] | 4.67 | 0.403 | 4.44 | 0.562 | 0.235 | -0.317 | 0.601 | 0.720 | 0.661 | ||
| NorESM1-ME | [-] | 6.79 | 0.554 | 6.31 | 0.668 | 0.854 | 0.581 | 0.832 | 0.707 |
Download Data |
Period Mean (original grids) [Pg] |
Model Period Mean (intersection) [Pg] |
Model Period Mean (complement) [Pg] |
Benchmark Period Mean (intersection) [Pg] |
Benchmark Period Mean (complement) [Pg] |
Bias [kg m-2] |
Bias Score [1] |
Spatial Distribution Score [1] |
Overall Score [1] |
|||
|---|---|---|---|---|---|---|---|---|---|---|---|---|
| Benchmark | [-] | 26.2 | ||||||||||
| bcc-csm1-1 | [-] | 476. | 24.3 | 444. | 26.2 | 0.00925 | 0.588 | 0.428 | 0.508 | |||
| bcc-csm1-1-m | [-] | 385. | 19.8 | 364. | 26.0 | 0.135 | -0.694 | 0.556 | 0.462 | 0.509 | ||
| CESM1-BGC | [-] | 529. | 18.6 | 509. | 26.1 | 0.0852 | -0.733 | 0.643 | 0.779 | 0.711 | ||
| E3SMv1-CTC | [-] | 582. | 24.7 | 557. | 26.2 | 0.0695 | 0.694 | 0.735 | 0.715 | |||
| E3SMv1-ECA | [-] | 378. | 18.9 | 360. | 26.2 | -0.665 | 0.611 | 0.627 | 0.619 | |||
| GFDL-ESM2G | [-] | 655. | 20.6 | 626. | 26.2 | -0.454 | 0.563 | 0.581 | 0.572 | |||
| inmcm4 | [-] | 603. | 58.3 | 547. | 25.2 | 0.941 | 4.21 | 0.452 | 0.773 | 0.613 | ||
| IPSL-CM5A-LR | [-] | 622. | 38.2 | 573. | 26.1 | 0.0250 | 2.12 | 0.532 | 0.793 | 0.662 | ||
| MeanCMIP5 | [-] | 500. | 26.2 | 474. | 26.2 | 0.280 | 0.673 | 0.659 | 0.666 | |||
| MIROC-ESM | [-] | 349. | 19.9 | 327. | 22.4 | 3.79 | -0.325 | 0.587 | 0.673 | 0.630 | ||
| MPI-ESM-LR | [-] | 335. | 10.6 | 322. | 25.3 | 0.852 | -1.87 | 0.518 | 0.225 | 0.371 | ||
| NorESM1-ME | [-] | 548. | 23.7 | 517. | 26.2 | -0.0361 | 0.630 | 0.824 | 0.727 |
Download Data |
Period Mean (original grids) [Pg] |
Model Period Mean (intersection) [Pg] |
Model Period Mean (complement) [Pg] |
Benchmark Period Mean (intersection) [Pg] |
Benchmark Period Mean (complement) [Pg] |
Bias [kg m-2] |
Bias Score [1] |
Spatial Distribution Score [1] |
Overall Score [1] |
|||
|---|---|---|---|---|---|---|---|---|---|---|---|---|
| Benchmark | [-] | 25.4 | ||||||||||
| bcc-csm1-1 | [-] | 30.2 | 23.1 | 6.94 | 25.4 | -0.103 | 0.587 | 0.423 | 0.505 | |||
| bcc-csm1-1-m | [-] | 23.7 | 19.0 | 5.75 | 25.4 | 0.137 | -0.767 | 0.556 | 0.457 | 0.506 | ||
| CESM1-BGC | [-] | 23.1 | 18.0 | 5.01 | 25.6 | 0.0688 | -0.840 | 0.644 | 0.776 | 0.710 | ||
| E3SMv1-CTC | [-] | 30.8 | 23.8 | 6.53 | 25.4 | -0.00839 | 0.696 | 0.736 | 0.716 | |||
| E3SMv1-ECA | [-] | 22.3 | 17.8 | 4.13 | 25.4 | -0.802 | 0.614 | 0.628 | 0.621 | |||
| GFDL-ESM2G | [-] | 25.8 | 19.1 | 5.03 | 25.5 | -0.704 | 0.565 | 0.560 | 0.563 | |||
| inmcm4 | [-] | 67.6 | 54.3 | 13.9 | 24.6 | 0.797 | 4.00 | 0.461 | 0.799 | 0.630 | ||
| IPSL-CM5A-LR | [-] | 49.4 | 37.2 | 15.2 | 25.5 | 0.00123 | 2.08 | 0.536 | 0.796 | 0.666 | ||
| MeanCMIP5 | [-] | 33.0 | 24.8 | 7.63 | 25.4 | 0.149 | 0.677 | 0.648 | 0.662 | |||
| MIROC-ESM | [-] | 26.6 | 19.0 | 7.13 | 21.9 | 3.46 | -0.401 | 0.590 | 0.663 | 0.627 | ||
| MPI-ESM-LR | [-] | 14.2 | 10.2 | 3.45 | 24.8 | 0.620 | -1.95 | 0.516 | 0.216 | 0.366 | ||
| NorESM1-ME | [-] | 28.9 | 23.2 | 6.38 | 25.5 | -0.0926 | 0.631 | 0.824 | 0.727 |
Temporally integrated period mean