Mean State
Download Data |
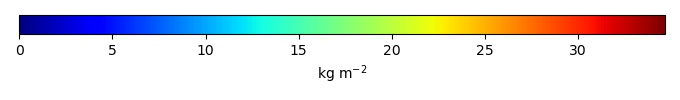
Period Mean (original grids) [Pg] |
Model Period Mean (intersection) [Pg] |
Model Period Mean (complement) [Pg] |
Benchmark Period Mean (intersection) [Pg] |
Benchmark Period Mean (complement) [Pg] |
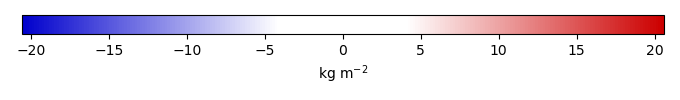
Bias [kg m-2] |
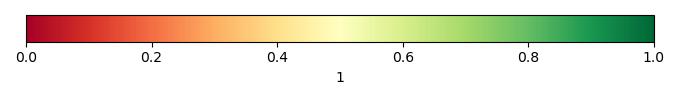
Bias Score [1] |
Spatial Distribution Score [1] |
Overall Score [1] |
|||
|---|---|---|---|---|---|---|---|---|---|---|---|---|
| Benchmark | [-] | 2.76 | ||||||||||
| bcc-csm1-1 | [-] | 17.8 | 1.58 | 16.7 | 2.76 | 0.000338 | -0.579 | 0.558 | 0.180 | 0.369 | ||
| bcc-csm1-1-m | [-] | 19.3 | 2.14 | 15.8 | 2.71 | 0.0546 | -0.244 | 0.580 | 0.382 | 0.481 | ||
| CESM1-BGC | [-] | 6.57 | 0.345 | 6.28 | 2.66 | 0.105 | -1.61 | 0.409 | 0.0337 | 0.221 | ||
| E3SMv1-CTC | [-] | 18.9 | 2.02 | 16.8 | 2.76 | 7.59e-05 | -0.149 | 0.572 | 0.194 | 0.383 | ||
| E3SMv1-ECA | [-] | 8.28 | 0.562 | 7.72 | 2.76 | 7.59e-05 | -1.42 | 0.440 | 0.0389 | 0.239 | ||
| GFDL-ESM2G | [-] | 67.0 | 9.27 | 59.2 | 2.76 | 5.41 | 0.376 | 0.709 | 0.543 | |||
| inmcm4 | [-] | 44.9 | 6.11 | 36.8 | 2.32 | 0.441 | 3.16 | 0.402 | 0.773 | 0.588 | ||
| IPSL-CM5A-LR | [-] | 61.9 | 6.50 | 52.3 | 2.76 | 0.00864 | 3.57 | 0.469 | 0.521 | 0.495 | ||
| MeanCMIP5 | [-] | 28.8 | 3.38 | 25.4 | 2.76 | 0.910 | 0.524 | 0.351 | 0.437 | |||
| MIROC-ESM | [-] | 25.0 | 3.97 | 21.5 | 1.72 | 1.05 | 2.05 | 0.418 | 0.701 | 0.559 | ||
| MPI-ESM-LR | [-] | 8.37 | 0.484 | 8.30 | 2.52 | 0.241 | -1.58 | 0.438 | 0.0463 | 0.242 | ||
| NorESM1-ME | [-] | 8.63 | 0.223 | 7.68 | 2.76 | -1.67 | 0.398 | 0.0303 | 0.214 |
Download Data |
Period Mean (original grids) [Pg] |
Model Period Mean (intersection) [Pg] |
Model Period Mean (complement) [Pg] |
Benchmark Period Mean (intersection) [Pg] |
Benchmark Period Mean (complement) [Pg] |
Bias [kg m-2] |
Bias Score [1] |
Spatial Distribution Score [1] |
Overall Score [1] |
|||
|---|---|---|---|---|---|---|---|---|---|---|---|---|
| Benchmark | [-] | 0.878 | ||||||||||
| bcc-csm1-1 | [-] | 13.5 | 1.27 | 11.8 | 0.877 | 1.57 | 0.623 | 0.631 | 0.627 | |||
| bcc-csm1-1-m | [-] | 9.37 | 0.759 | 8.62 | 0.694 | 0.000100 | 0.272 | 0.536 | 0.529 | 0.533 | ||
| CESM1-BGC | [-] | 8.85 | 0.650 | 8.18 | 0.588 | 0.00736 | 0.981 | 0.624 | 0.861 | 0.742 | ||
| E3SMv1-CTC | [-] | 6.94 | 0.973 | 6.44 | 0.878 | 5.48e-05 | 1.12 | 0.598 | 0.693 | 0.646 | ||
| E3SMv1-ECA | [-] | 6.55 | 1.02 | 5.86 | 0.878 | 5.48e-05 | 1.22 | 0.540 | 0.632 | 0.586 | ||
| GFDL-ESM2G | [-] | 16.9 | 1.41 | 15.5 | 0.744 | 3.12 | 0.605 | 0.813 | 0.709 | |||
| inmcm4 | [-] | 16.4 | 4.00 | 14.4 | 0.743 | 0.135 | 7.72 | 0.176 | 0.339 | 0.257 | ||
| IPSL-CM5A-LR | [-] | 5.47 | 1.09 | 4.29 | 0.716 | 0.0109 | 2.79 | 0.523 | 0.640 | 0.582 | ||
| MeanCMIP5 | [-] | 9.38 | 1.36 | 8.59 | 0.878 | 1.99 | 0.676 | 0.892 | 0.784 | |||
| MIROC-ESM | [-] | 4.39 | 0.879 | 3.02 | 0.507 | 0.370 | 0.932 | 0.588 | 0.820 | 0.704 | ||
| MPI-ESM-LR | [-] | 4.67 | 0.401 | 4.44 | 0.681 | 0.197 | -0.615 | 0.555 | 0.520 | 0.537 | ||
| NorESM1-ME | [-] | 6.79 | 0.544 | 6.32 | 0.727 | 0.753 | 0.626 | 0.881 | 0.754 |
Download Data |
Period Mean (original grids) [Pg] |
Model Period Mean (intersection) [Pg] |
Model Period Mean (complement) [Pg] |
Benchmark Period Mean (intersection) [Pg] |
Benchmark Period Mean (complement) [Pg] |
Bias [kg m-2] |
Bias Score [1] |
Spatial Distribution Score [1] |
Overall Score [1] |
|||
|---|---|---|---|---|---|---|---|---|---|---|---|---|
| Benchmark | [-] | 30.1 | ||||||||||
| bcc-csm1-1 | [-] | 476. | 25.2 | 443. | 30.1 | 0.000275 | -0.292 | 0.568 | 0.368 | 0.468 | ||
| bcc-csm1-1-m | [-] | 385. | 21.4 | 363. | 29.9 | 0.201 | -0.843 | 0.546 | 0.368 | 0.457 | ||
| CESM1-BGC | [-] | 529. | 18.8 | 509. | 29.9 | 0.176 | -1.03 | 0.601 | 0.659 | 0.630 | ||
| E3SMv1-CTC | [-] | 582. | 26.3 | 556. | 30.1 | 2.01e-05 | -0.142 | 0.651 | 0.595 | 0.623 | ||
| E3SMv1-ECA | [-] | 378. | 19.1 | 359. | 30.1 | 2.01e-05 | -0.974 | 0.577 | 0.519 | 0.548 | ||
| GFDL-ESM2G | [-] | 655. | 28.9 | 618. | 30.1 | 0.191 | 0.534 | 0.620 | 0.577 | |||
| inmcm4 | [-] | 603. | 63.4 | 542. | 28.7 | 1.37 | 3.99 | 0.462 | 0.824 | 0.643 | ||
| IPSL-CM5A-LR | [-] | 622. | 44.3 | 567. | 30.1 | 0.0202 | 2.24 | 0.542 | 0.780 | 0.661 | ||
| MeanCMIP5 | [-] | 500. | 29.0 | 471. | 30.1 | 0.201 | 0.639 | 0.511 | 0.575 | |||
| MIROC-ESM | [-] | 349. | 23.5 | 323. | 24.8 | 5.32 | -0.156 | 0.568 | 0.598 | 0.583 | ||
| MPI-ESM-LR | [-] | 335. | 10.8 | 322. | 29.0 | 1.09 | -2.05 | 0.497 | 0.176 | 0.336 | ||
| NorESM1-ME | [-] | 548. | 23.7 | 517. | 30.1 | -0.448 | 0.596 | 0.731 | 0.663 |
Download Data |
Period Mean (original grids) [Pg] |
Model Period Mean (intersection) [Pg] |
Model Period Mean (complement) [Pg] |
Benchmark Period Mean (intersection) [Pg] |
Benchmark Period Mean (complement) [Pg] |
Bias [kg m-2] |
Bias Score [1] |
Spatial Distribution Score [1] |
Overall Score [1] |
|||
|---|---|---|---|---|---|---|---|---|---|---|---|---|
| Benchmark | [-] | 26.5 | ||||||||||
| bcc-csm1-1 | [-] | 30.2 | 22.4 | 7.61 | 26.5 | -0.360 | 0.568 | 0.322 | 0.445 | |||
| bcc-csm1-1-m | [-] | 23.7 | 18.5 | 6.23 | 26.5 | 0.166 | -1.03 | 0.542 | 0.358 | 0.450 | ||
| CESM1-BGC | [-] | 23.1 | 17.8 | 5.14 | 26.7 | 0.0803 | -1.04 | 0.619 | 0.672 | 0.646 | ||
| E3SMv1-CTC | [-] | 30.8 | 23.4 | 6.93 | 26.5 | -0.219 | 0.660 | 0.610 | 0.635 | |||
| E3SMv1-ECA | [-] | 22.3 | 17.6 | 4.41 | 26.5 | -1.04 | 0.592 | 0.509 | 0.551 | |||
| GFDL-ESM2G | [-] | 25.8 | 18.3 | 5.84 | 26.6 | -1.01 | 0.548 | 0.454 | 0.501 | |||
| inmcm4 | [-] | 67.6 | 53.3 | 14.9 | 25.7 | 0.834 | 3.91 | 0.476 | 0.840 | 0.658 | ||
| IPSL-CM5A-LR | [-] | 49.4 | 36.8 | 15.6 | 26.6 | 0.00159 | 1.97 | 0.550 | 0.819 | 0.684 | ||
| MeanCMIP5 | [-] | 33.0 | 24.3 | 8.11 | 26.5 | -0.0619 | 0.650 | 0.523 | 0.586 | |||
| MIROC-ESM | [-] | 26.6 | 18.7 | 7.45 | 22.6 | 3.94 | -0.558 | 0.579 | 0.580 | 0.579 | ||
| MPI-ESM-LR | [-] | 14.2 | 9.95 | 3.65 | 25.8 | 0.682 | -2.22 | 0.502 | 0.161 | 0.332 | ||
| NorESM1-ME | [-] | 28.9 | 22.9 | 6.65 | 26.6 | -0.290 | 0.615 | 0.733 | 0.674 |
Temporally integrated period mean