Mean State
Download Data |
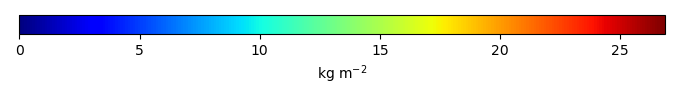
Period Mean (original grids) [Pg] |
Model Period Mean (intersection) [Pg] |
Benchmark Period Mean (intersection) [Pg] |
Model Period Mean (complement) [Pg] |
Benchmark Period Mean (complement) [Pg] |
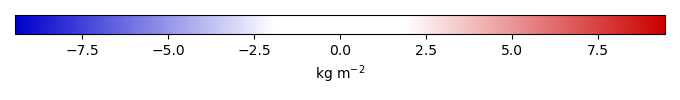
Bias [kg m-2] |
Bias Score [1] |
Spatial Distribution Score [1] |
Overall Score [1] |
|||
|---|---|---|---|---|---|---|---|---|---|---|---|---|
| Benchmark | [-] | 21.5 | ||||||||||
| ACCESS-ESM1-5 | [-] | 662. | 37.8 | 21.4 | 624. | 0.0678 | 1.97 | 0.538 | 0.792 | 0.665 | ||
| BCC-CSM2-MR | [-] | 386. | 22.0 | 21.3 | 363. | 0.143 | 0.188 | 0.638 | 0.864 | 0.751 | ||
| BGCLND | [-] | 666. | 33.0 | 21.4 | 633. | 0.0420 | 1.25 | 0.553 | 0.873 | 0.713 | ||
| BGCLNDATM_progCO2 | [-] | 704. | 27.5 | 21.4 | 677. | 0.0420 | 0.659 | 0.626 | 0.855 | 0.740 | ||
| CanESM5 | [-] | 509. | 33.0 | 21.5 | 467. | 1.73 | 0.520 | 0.803 | 0.662 | |||
| CNRM-ESM2-1 | [-] | 490. | 45.4 | 21.5 | 443. | 0.00414 | 3.24 | 0.458 | 0.587 | 0.523 | ||
| EC-Earth3-CC | [-] | 384. | 20.3 | 21.5 | 363. | -0.115 | 0.637 | 0.715 | 0.676 | |||
| MeanCMIP6 | [-] | 447. | 29.1 | 21.5 | 418. | 1.17 | 0.639 | 0.890 | 0.765 | |||
| MIROC-ES2L | [-] | 520. | 35.2 | 21.5 | 474. | 0.000128 | 1.90 | 0.520 | 0.794 | 0.657 | ||
| MPI-ESM1-2-LR | [-] | 369. | 11.3 | 20.7 | 356. | 0.779 | -1.05 | 0.476 | 0.360 | 0.418 | ||
| MRI-ESM2-0 | [-] | 486. | 27.9 | 21.3 | 457. | 0.169 | 1.11 | 0.555 | 0.740 | 0.647 | ||
| NorESM2-LM | [-] | 463. | 15.0 | 21.5 | 442. | -0.234 | 0.547 | 0.782 | 0.664 | |||
| UKESM1-0-LL | [-] | 545. | 26.5 | 21.3 | 516. | 0.235 | 1.05 | 0.601 | 0.832 | 0.716 |
Download Data |
Period Mean (original grids) [Pg] |
Model Period Mean (intersection) [Pg] |
Benchmark Period Mean (intersection) [Pg] |
Model Period Mean (complement) [Pg] |
Benchmark Period Mean (complement) [Pg] |
Bias [kg m-2] |
Bias Score [1] |
Spatial Distribution Score [1] |
Overall Score [1] |
|||
|---|---|---|---|---|---|---|---|---|---|---|---|---|
| Benchmark | [-] | 1.98 | ||||||||||
| ACCESS-ESM1-5 | [-] | 138. | 3.11 | 1.93 | 142. | 0.0442 | 1.09 | 0.554 | 0.848 | 0.701 | ||
| BCC-CSM2-MR | [-] | 81.3 | 2.16 | 1.94 | 82.2 | 0.0406 | 0.328 | 0.556 | 0.847 | 0.701 | ||
| BGCLND | [-] | 97.2 | 4.28 | 1.93 | 92.9 | 0.0418 | 1.70 | 0.486 | 0.659 | 0.572 | ||
| BGCLNDATM_progCO2 | [-] | 73.4 | 3.08 | 1.93 | 70.3 | 0.0418 | 0.830 | 0.534 | 0.478 | 0.506 | ||
| CanESM5 | [-] | 87.0 | 0.664 | 1.98 | 87.6 | -0.525 | 0.532 | 0.800 | 0.666 | |||
| CNRM-ESM2-1 | [-] | 98.2 | 2.60 | 1.97 | 98.1 | 0.00438 | 0.787 | 0.521 | 0.817 | 0.669 | ||
| EC-Earth3-CC | [-] | 46.6 | 1.04 | 1.98 | 44.9 | -0.604 | 0.451 | 0.583 | 0.517 | |||
| MeanCMIP6 | [-] | 82.2 | 1.68 | 1.98 | 80.6 | 0.0721 | 0.614 | 0.848 | 0.731 | |||
| MIROC-ES2L | [-] | 90.2 | 2.59 | 1.98 | 88.9 | 0.557 | 0.543 | 0.815 | 0.679 | |||
| MPI-ESM1-2-LR | [-] | 52.6 | 0.777 | 1.80 | 53.0 | 0.174 | -0.793 | 0.473 | 0.241 | 0.357 | ||
| MRI-ESM2-0 | [-] | 76.9 | 6.22 | 1.96 | 73.3 | 0.0179 | 4.41 | 0.415 | 0.449 | 0.432 | ||
| NorESM2-LM | [-] | 98.4 | 4.20 | 1.98 | 89.9 | 2.36 | 0.484 | 0.822 | 0.653 | |||
| UKESM1-0-LL | [-] | 71.0 | 3.73 | 1.89 | 67.3 | 0.0854 | 2.12 | 0.551 | 0.787 | 0.669 |
Download Data |
Period Mean (original grids) [Pg] |
Model Period Mean (intersection) [Pg] |
Benchmark Period Mean (intersection) [Pg] |
Model Period Mean (complement) [Pg] |
Benchmark Period Mean (complement) [Pg] |
Bias [kg m-2] |
Bias Score [1] |
Spatial Distribution Score [1] |
Overall Score [1] |
|||
|---|---|---|---|---|---|---|---|---|---|---|---|---|
| Benchmark | [-] | 17.0 | ||||||||||
| ACCESS-ESM1-5 | [-] | 229. | 29.7 | 16.9 | 201. | 0.0654 | 2.02 | 0.540 | 0.791 | 0.666 | ||
| BCC-CSM2-MR | [-] | 132. | 15.6 | 16.9 | 115. | 0.158 | -0.0537 | 0.638 | 0.834 | 0.736 | ||
| BGCLND | [-] | 151. | 24.8 | 17.0 | 126. | 0.0468 | 1.12 | 0.534 | 0.867 | 0.700 | ||
| BGCLNDATM_progCO2 | [-] | 122. | 20.9 | 17.0 | 101. | 0.0468 | 0.561 | 0.620 | 0.823 | 0.721 | ||
| CanESM5 | [-] | 142. | 23.2 | 17.0 | 124. | 1.23 | 0.535 | 0.827 | 0.681 | |||
| CNRM-ESM2-1 | [-] | 172. | 28.0 | 17.0 | 143. | 0.00504 | 1.97 | 0.536 | 0.798 | 0.667 | ||
| EC-Earth3-CC | [-] | 92.4 | 15.5 | 17.0 | 77.3 | -0.208 | 0.616 | 0.687 | 0.651 | |||
| MeanCMIP6 | [-] | 137. | 20.6 | 17.0 | 117. | 0.777 | 0.664 | 0.868 | 0.766 | |||
| MIROC-ES2L | [-] | 157. | 25.4 | 17.0 | 136. | 0.000128 | 1.50 | 0.544 | 0.812 | 0.678 | ||
| MPI-ESM1-2-LR | [-] | 76.7 | 7.23 | 16.4 | 69.9 | 0.575 | -1.36 | 0.459 | 0.202 | 0.330 | ||
| MRI-ESM2-0 | [-] | 137. | 24.0 | 16.8 | 112. | 0.168 | 1.49 | 0.586 | 0.765 | 0.676 | ||
| NorESM2-LM | [-] | 128. | 11.5 | 17.0 | 115. | -0.280 | 0.547 | 0.770 | 0.658 | |||
| UKESM1-0-LL | [-] | 118. | 19.6 | 16.8 | 98.2 | 0.226 | 0.725 | 0.625 | 0.754 | 0.690 |
Temporally integrated period mean