Mean State
Download Data |
Period Mean (original grids) [Pg] |
Model Period Mean (intersection) [Pg] |
Benchmark Period Mean (intersection) [Pg] |
Model Period Mean (complement) [Pg] |
Benchmark Period Mean (complement) [Pg] |
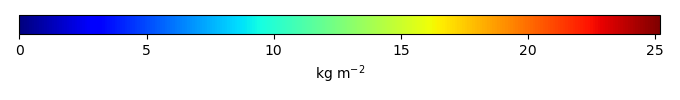
Bias [kg m-2] |
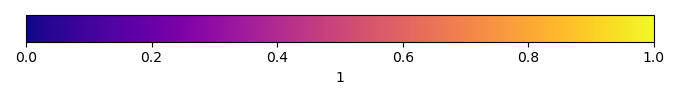
Bias Score [1] |
Spatial Distribution Score [1] |
Overall Score [1] |
|||
|---|---|---|---|---|---|---|---|---|---|---|---|---|
| Benchmark | [-] | 57.4 | ||||||||||
| ACCESS-ESM1-5 | [-] | 86.3 | 84.1 | 57.4 | 0.368 | 0.0397 | 2.81 | 0.0313 | 0.916 | 0.474 | ||
| BCC-CSM2-MR | [-] | 48.8 | 48.5 | 56.9 | 0.255 | 0.0666 | -0.794 | 0.0264 | 0.892 | 0.459 | ||
| BGCLND | [-] | 97.4 | 97.3 | 57.4 | 0.134 | 0.0117 | 3.96 | 0.0150 | 0.490 | 0.252 | ||
| BGCLNDATM_progCO2 | [-] | 117. | 117. | 57.4 | 0.0947 | 0.0117 | 5.94 | 0.0170 | 0.395 | 0.206 | ||
| CanESM5 | [-] | 93.4 | 85.4 | 57.4 | 1.84 | 3.19 | 0.0384 | 0.918 | 0.478 | |||
| CNRM-ESM2-1 | [-] | 36.7 | 36.8 | 57.4 | 0.445 | 0.0323 | -1.86 | 0.0174 | 0.765 | 0.391 | ||
| EC-Earth3-CC | [-] | 60.2 | 59.1 | 57.4 | 0.0112 | 0.180 | 0.0231 | 0.915 | 0.469 | |||
| MeanCMIP6 | [-] | 65.8 | 66.0 | 57.4 | 0.820 | 1.16 | 0.0261 | 0.879 | 0.453 | |||
| MIROC-ES2L | [-] | 78.2 | 70.6 | 57.4 | 2.70 | 0.0221 | 1.71 | 0.0168 | 0.835 | 0.426 | ||
| MPI-ESM1-2-LR | [-] | 44.1 | 45.7 | 54.6 | 0.0959 | 2.85 | -0.891 | 0.0233 | 0.894 | 0.459 | ||
| MRI-ESM2-0 | [-] | 77.4 | 77.1 | 56.9 | 0.355 | 0.0801 | 2.10 | 0.0354 | 0.839 | 0.437 | ||
| NorESM2-LM | [-] | 49.3 | 49.5 | 57.4 | 1.02 | -0.472 | 0.0247 | 0.895 | 0.460 | |||
| UKESM1-0-LL | [-] | 62.3 | 62.0 | 57.3 | 0.503 | 0.0830 | 0.762 | 0.0193 | 0.902 | 0.460 |
Download Data |
Period Mean (original grids) [Pg] |
Model Period Mean (intersection) [Pg] |
Benchmark Period Mean (intersection) [Pg] |
Model Period Mean (complement) [Pg] |
Benchmark Period Mean (complement) [Pg] |
Bias [kg m-2] |
Bias Score [1] |
Spatial Distribution Score [1] |
Overall Score [1] |
|||
|---|---|---|---|---|---|---|---|---|---|---|---|---|
| Benchmark | [-] | 24.8 | ||||||||||
| ACCESS-ESM1-5 | [-] | 32.3 | 31.1 | 23.9 | 1.35 | 0.922 | 3.60 | 0.0278 | 0.780 | 0.404 | ||
| BCC-CSM2-MR | [-] | 28.6 | 26.8 | 24.1 | 1.80 | 0.717 | 2.54 | 0.0327 | 0.864 | 0.448 | ||
| BGCLND | [-] | 62.2 | 61.5 | 24.6 | 0.979 | 0.224 | 8.82 | 0.0127 | 0.723 | 0.368 | ||
| BGCLNDATM_progCO2 | [-] | 68.0 | 67.6 | 24.6 | 0.857 | 0.224 | 10.5 | 0.00729 | 0.642 | 0.325 | ||
| CanESM5 | [-] | 39.3 | 30.5 | 24.8 | 7.92 | 7.91 | 0.0187 | 0.893 | 0.456 | |||
| CNRM-ESM2-1 | [-] | 34.7 | 31.9 | 24.6 | 3.18 | 0.176 | 7.53 | 0.0259 | 0.859 | 0.442 | ||
| EC-Earth3-CC | [-] | 30.3 | 30.0 | 24.9 | 0.142 | 1.02 | 0.0180 | 0.656 | 0.337 | |||
| MeanCMIP6 | [-] | 27.7 | 24.8 | 24.8 | 3.38 | 3.92 | 0.0500 | 0.834 | 0.442 | |||
| MIROC-ES2L | [-] | 27.4 | 18.2 | 24.5 | 7.74 | 0.301 | 2.81 | 0.0391 | 0.644 | 0.342 | ||
| MPI-ESM1-2-LR | [-] | 22.2 | 20.6 | 15.0 | 2.13 | 9.86 | 2.75 | 0.0453 | 0.922 | 0.484 | ||
| MRI-ESM2-0 | [-] | 48.3 | 45.0 | 23.8 | 3.24 | 0.958 | 10.3 | 0.00690 | 0.834 | 0.420 | ||
| NorESM2-LM | [-] | 46.8 | 40.0 | 24.8 | 6.57 | 10.2 | 0.00458 | 0.784 | 0.394 | |||
| UKESM1-0-LL | [-] | 38.4 | 34.1 | 24.1 | 4.68 | 0.729 | 8.13 | 0.0226 | 0.740 | 0.381 |
Download Data |
Period Mean (original grids) [Pg] |
Model Period Mean (intersection) [Pg] |
Benchmark Period Mean (intersection) [Pg] |
Model Period Mean (complement) [Pg] |
Benchmark Period Mean (complement) [Pg] |
Bias [kg m-2] |
Bias Score [1] |
Spatial Distribution Score [1] |
Overall Score [1] |
|||
|---|---|---|---|---|---|---|---|---|---|---|---|---|
| Benchmark | [-] | 378. | ||||||||||
| ACCESS-ESM1-5 | [-] | 666. | 660. | 376. | 5.92 | 1.70 | 2.21 | 0.0257 | 0.679 | 0.352 | ||
| BCC-CSM2-MR | [-] | 395. | 388. | 376. | 5.57 | 2.10 | 0.243 | 0.0393 | 0.905 | 0.472 | ||
| BGCLND | [-] | 669. | 665. | 377. | 3.37 | 0.644 | 2.00 | 0.0313 | 0.517 | 0.274 | ||
| BGCLNDATM_progCO2 | [-] | 708. | 705. | 377. | 2.82 | 0.644 | 2.29 | 0.0293 | 0.414 | 0.222 | ||
| CanESM5 | [-] | 516. | 492. | 378. | 15.5 | 1.41 | 0.0330 | 0.798 | 0.416 | |||
| CNRM-ESM2-1 | [-] | 500. | 486. | 378. | 12.3 | 0.237 | 1.27 | 0.0342 | 0.789 | 0.412 | ||
| EC-Earth3-CC | [-] | 389. | 388. | 378. | 0.807 | 0.0655 | 0.0296 | 0.820 | 0.425 | |||
| MeanCMIP6 | [-] | 455. | 445. | 378. | 10.4 | 0.857 | 0.0420 | 0.910 | 0.476 | |||
| MIROC-ES2L | [-] | 528. | 496. | 377. | 21.7 | 0.374 | 1.28 | 0.0335 | 0.827 | 0.430 | ||
| MPI-ESM1-2-LR | [-] | 372. | 365. | 350. | 5.56 | 27.4 | 0.121 | 0.0260 | 0.823 | 0.424 | ||
| MRI-ESM2-0 | [-] | 496. | 486. | 376. | 9.13 | 1.62 | 1.19 | 0.0192 | 0.625 | 0.322 | ||
| NorESM2-LM | [-] | 468. | 448. | 378. | 13.9 | 1.08 | 0.0290 | 0.738 | 0.383 | |||
| UKESM1-0-LL | [-] | 547. | 533. | 375. | 11.5 | 2.42 | 1.65 | 0.0289 | 0.759 | 0.394 |
Download Data |
Period Mean (original grids) [Pg] |
Model Period Mean (intersection) [Pg] |
Benchmark Period Mean (intersection) [Pg] |
Model Period Mean (complement) [Pg] |
Benchmark Period Mean (complement) [Pg] |
Bias [kg m-2] |
Bias Score [1] |
Spatial Distribution Score [1] |
Overall Score [1] |
|||
|---|---|---|---|---|---|---|---|---|---|---|---|---|
| Benchmark | [-] | 84.2 | ||||||||||
| ACCESS-ESM1-5 | [-] | 142. | 147. | 84.0 | 1.05 | 0.192 | 1.94 | 0.0337 | 0.508 | 0.271 | ||
| BCC-CSM2-MR | [-] | 83.7 | 85.7 | 83.9 | 1.14 | 0.262 | 0.118 | 0.0618 | 0.846 | 0.454 | ||
| BGCLND | [-] | 99.6 | 98.9 | 83.9 | 0.758 | 0.232 | 0.433 | 0.0692 | 0.911 | 0.490 | ||
| BGCLNDATM_progCO2 | [-] | 75.7 | 75.0 | 83.9 | 0.616 | 0.232 | -0.272 | 0.0557 | 0.883 | 0.470 | ||
| CanESM5 | [-] | 89.2 | 88.3 | 84.2 | 2.22 | 0.321 | 0.0466 | 0.740 | 0.393 | |||
| CNRM-ESM2-1 | [-] | 102. | 103. | 84.1 | 1.54 | 0.0165 | 0.725 | 0.0561 | 0.817 | 0.437 | ||
| EC-Earth3-CC | [-] | 48.8 | 48.0 | 84.2 | 0.118 | -1.05 | 0.0272 | 0.785 | 0.406 | |||
| MeanCMIP6 | [-] | 85.3 | 83.9 | 84.2 | 1.41 | 0.122 | 0.0561 | 0.894 | 0.475 | |||
| MIROC-ES2L | [-] | 93.1 | 91.6 | 84.1 | 2.83 | 0.0118 | 0.321 | 0.0424 | 0.776 | 0.409 | ||
| MPI-ESM1-2-LR | [-] | 54.3 | 54.9 | 81.8 | 0.609 | 2.36 | -0.840 | 0.0373 | 0.839 | 0.438 | ||
| MRI-ESM2-0 | [-] | 81.4 | 81.7 | 84.0 | 2.34 | 0.197 | 0.264 | 0.0329 | 0.599 | 0.316 | ||
| NorESM2-LM | [-] | 101. | 94.8 | 84.2 | 1.71 | 0.609 | 0.0413 | 0.695 | 0.368 | |||
| UKESM1-0-LL | [-] | 74.0 | 72.5 | 83.8 | 1.51 | 0.387 | -0.126 | 0.0552 | 0.885 | 0.470 |
Download Data |
Period Mean (original grids) [Pg] |
Model Period Mean (intersection) [Pg] |
Benchmark Period Mean (intersection) [Pg] |
Model Period Mean (complement) [Pg] |
Benchmark Period Mean (complement) [Pg] |
Bias [kg m-2] |
Bias Score [1] |
Spatial Distribution Score [1] |
Overall Score [1] |
|||
|---|---|---|---|---|---|---|---|---|---|---|---|---|
| Benchmark | [-] | 81.9 | ||||||||||
| ACCESS-ESM1-5 | [-] | 124. | 124. | 81.8 | 0.208 | 0.0475 | 5.18 | 0.0175 | 0.860 | 0.439 | ||
| BCC-CSM2-MR | [-] | 78.4 | 78.2 | 81.7 | 0.210 | 0.157 | -0.272 | 0.0248 | 0.909 | 0.467 | ||
| BGCLND | [-] | 192. | 192. | 81.9 | 0.158 | 0.00681 | 13.0 | 0.00757 | 0.425 | 0.216 | ||
| BGCLNDATM_progCO2 | [-] | 227. | 226. | 81.9 | 0.129 | 0.00681 | 17.1 | 0.00427 | 0.312 | 0.158 | ||
| CanESM5 | [-] | 60.5 | 56.3 | 81.9 | 0.356 | -2.64 | 0.0204 | 0.878 | 0.449 | |||
| CNRM-ESM2-1 | [-] | 93.4 | 93.2 | 81.9 | 0.415 | 0.0139 | 1.63 | 0.0315 | 0.956 | 0.494 | ||
| EC-Earth3-CC | [-] | 97.9 | 97.6 | 81.9 | 0.0604 | 1.78 | 0.0142 | 0.637 | 0.326 | |||
| MeanCMIP6 | [-] | 72.2 | 71.8 | 81.9 | 0.413 | -0.910 | 0.0280 | 0.624 | 0.326 | |||
| MIROC-ES2L | [-] | 92.4 | 88.0 | 81.9 | 0.977 | 0.0212 | 1.16 | 0.0342 | 0.837 | 0.436 | ||
| MPI-ESM1-2-LR | [-] | 94.8 | 92.1 | 80.4 | 0.101 | 1.52 | 1.45 | 0.0143 | 0.853 | 0.434 | ||
| MRI-ESM2-0 | [-] | 113. | 113. | 81.7 | 0.265 | 0.212 | 3.96 | 0.00160 | 0.728 | 0.365 | ||
| NorESM2-LM | [-] | 132. | 130. | 81.9 | 0.927 | 6.33 | 0.0135 | 0.880 | 0.447 | |||
| UKESM1-0-LL | [-] | 115. | 115. | 81.8 | 0.434 | 0.131 | 4.34 | 0.0134 | 0.904 | 0.459 |
Download Data |
Period Mean (original grids) [Pg] |
Model Period Mean (intersection) [Pg] |
Benchmark Period Mean (intersection) [Pg] |
Model Period Mean (complement) [Pg] |
Benchmark Period Mean (complement) [Pg] |
Bias [kg m-2] |
Bias Score [1] |
Spatial Distribution Score [1] |
Overall Score [1] |
|||
|---|---|---|---|---|---|---|---|---|---|---|---|---|
| Benchmark | [-] | 125. | ||||||||||
| ACCESS-ESM1-5 | [-] | 233. | 232. | 124. | 2.64 | 0.575 | 2.28 | 0.0304 | 0.530 | 0.280 | ||
| BCC-CSM2-MR | [-] | 136. | 132. | 124. | 2.15 | 0.887 | 0.277 | 0.0562 | 0.844 | 0.450 | ||
| BGCLND | [-] | 154. | 153. | 125. | 1.10 | 0.394 | 0.544 | 0.0557 | 0.881 | 0.468 | ||
| BGCLNDATM_progCO2 | [-] | 124. | 123. | 125. | 0.883 | 0.394 | -0.0373 | 0.0534 | 0.900 | 0.476 | ||
| CanESM5 | [-] | 146. | 144. | 125. | 6.25 | 0.753 | 0.0419 | 0.749 | 0.395 | |||
| CNRM-ESM2-1 | [-] | 178. | 172. | 125. | 5.55 | 0.0335 | 1.32 | 0.0456 | 0.741 | 0.393 | ||
| EC-Earth3-CC | [-] | 96.0 | 96.0 | 125. | 0.313 | -0.560 | 0.0364 | 0.825 | 0.431 | |||
| MeanCMIP6 | [-] | 142. | 139. | 125. | 3.64 | 0.536 | 0.0588 | 0.896 | 0.478 | |||
| MIROC-ES2L | [-] | 162. | 158. | 125. | 9.16 | 0.0895 | 0.932 | 0.0408 | 0.744 | 0.392 | ||
| MPI-ESM1-2-LR | [-] | 78.8 | 78.3 | 119. | 1.03 | 5.73 | -0.853 | 0.0358 | 0.794 | 0.415 | ||
| MRI-ESM2-0 | [-] | 144. | 138. | 124. | 4.58 | 0.515 | 0.690 | 0.0313 | 0.553 | 0.292 | ||
| NorESM2-LM | [-] | 131. | 126. | 125. | 4.27 | 0.412 | 0.0397 | 0.714 | 0.377 | |||
| UKESM1-0-LL | [-] | 122. | 118. | 124. | 3.00 | 0.888 | 0.183 | 0.0539 | 0.881 | 0.467 |
Temporally integrated period mean