Mean State
Download Data |
Period Mean (original grids) [Pg yr-1] |
Model Period Mean (intersection) [Pg yr-1] |
Benchmark Period Mean (intersection) [Pg yr-1] |
Model Period Mean (complement) [Pg yr-1] |
Benchmark Period Mean (complement) [Pg yr-1] |
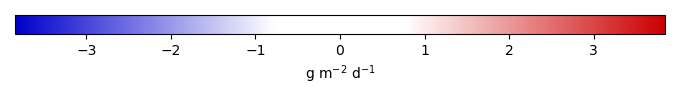
Bias [g m-2 d-1] |
RMSE [g m-2 d-1] |
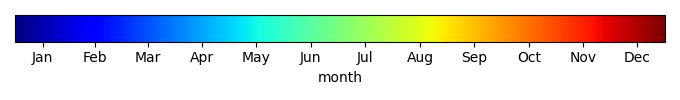
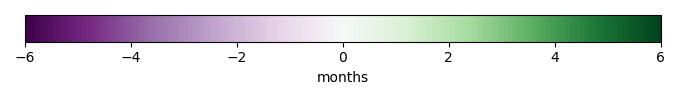
Phase Shift [months] |
Bias Score [1] |
RMSE Score [1] |
Seasonal Cycle Score [1] |
Spatial Distribution Score [1] |
Overall Score [1] |
|||
|---|---|---|---|---|---|---|---|---|---|---|---|---|---|---|---|---|
| Benchmark | [-] | 16.7 | ||||||||||||||
| BCC-CSM2-MR | [-] | 16.2 | 15.8 | 16.4 | 0.399 | 0.00416 | -0.125 | 1.80 | 1.87 | 0.516 | 0.445 | 0.715 | 0.917 | 0.608 | ||
| BGCv2LND.GSW | [-] | 18.3 | 17.7 | 16.7 | 0.619 | 0.287 | 1.58 | 1.70 | 0.554 | 0.473 | 0.747 | 0.940 | 0.637 | |||
| BGCv2LNDATM | [-] | 21.8 | 21.2 | 16.7 | 0.642 | 1.26 | 2.38 | 2.05 | 0.359 | 0.481 | 0.634 | 0.771 | 0.545 | |||
| CanESM5 | [-] | 22.9 | 20.2 | 16.7 | 0.999 | 1.22 | 2.25 | 2.80 | 0.418 | 0.402 | 0.526 | 0.947 | 0.539 | |||
| GFDL-ESM4 | [-] | 15.5 | 15.3 | 16.7 | 0.428 | -0.283 | 1.92 | 2.87 | 0.548 | 0.379 | 0.525 | 0.956 | 0.557 | |||
| MeanCMIP6 | [-] | 16.7 | 16.6 | 16.7 | 0.532 | 0.124 | 1.52 | 2.27 | 0.650 | 0.461 | 0.599 | 0.985 | 0.631 | |||
| MIROC-ES2L | [-] | 17.0 | 14.9 | 16.7 | 0.935 | 0.000127 | -0.347 | 2.36 | 2.83 | 0.416 | 0.341 | 0.500 | 0.965 | 0.513 |
Download Data |
Period Mean (original grids) [Pg yr-1] |
Model Period Mean (intersection) [Pg yr-1] |
Benchmark Period Mean (intersection) [Pg yr-1] |
Model Period Mean (complement) [Pg yr-1] |
Benchmark Period Mean (complement) [Pg yr-1] |
Bias [g m-2 d-1] |
RMSE [g m-2 d-1] |
Phase Shift [months] |
Bias Score [1] |
RMSE Score [1] |
Seasonal Cycle Score [1] |
Spatial Distribution Score [1] |
Overall Score [1] |
|||
|---|---|---|---|---|---|---|---|---|---|---|---|---|---|---|---|---|
| Benchmark | [-] | 7.85 | ||||||||||||||
| BCC-CSM2-MR | [-] | 8.02 | 6.25 | 7.73 | 1.77 | 0.144 | -0.269 | 2.71 | 2.26 | 0.132 | 0.239 | 0.645 | 0.293 | 0.309 | ||
| BGCv2LND.GSW | [-] | 12.9 | 9.26 | 7.85 | 3.68 | 1.36 | 1.85 | 2.12 | 0.125 | 0.477 | 0.677 | 0.845 | 0.521 | |||
| BGCv2LNDATM | [-] | 14.1 | 10.4 | 7.85 | 3.69 | 2.48 | 3.14 | 1.28 | 0.0657 | 0.460 | 0.821 | 0.533 | 0.468 | |||
| CanESM5 | [-] | 9.69 | 5.62 | 7.87 | 3.74 | 1.76 | 2.02 | 2.26 | 0.0799 | 0.456 | 0.640 | 0.960 | 0.518 | |||
| GFDL-ESM4 | [-] | 7.62 | 5.89 | 7.85 | 1.81 | 0.126 | 1.23 | 2.02 | 0.276 | 0.351 | 0.678 | 0.870 | 0.505 | |||
| MeanCMIP6 | [-] | 7.15 | 5.24 | 7.85 | 2.01 | -0.345 | 1.08 | 2.13 | 0.304 | 0.429 | 0.659 | 0.979 | 0.560 | |||
| MIROC-ES2L | [-] | 6.29 | 3.08 | 7.82 | 2.90 | 0.0530 | -2.69 | 3.03 | 2.58 | 0.0853 | 0.285 | 0.588 | 0.923 | 0.433 |
Download Data |
Period Mean (original grids) [Pg yr-1] |
Model Period Mean (intersection) [Pg yr-1] |
Benchmark Period Mean (intersection) [Pg yr-1] |
Model Period Mean (complement) [Pg yr-1] |
Benchmark Period Mean (complement) [Pg yr-1] |
Bias [g m-2 d-1] |
RMSE [g m-2 d-1] |
Phase Shift [months] |
Bias Score [1] |
RMSE Score [1] |
Seasonal Cycle Score [1] |
Spatial Distribution Score [1] |
Overall Score [1] |
|||
|---|---|---|---|---|---|---|---|---|---|---|---|---|---|---|---|---|
| Benchmark | [-] | 114. | ||||||||||||||
| BCC-CSM2-MR | [-] | 109. | 103. | 113. | 5.66 | 0.671 | -0.131 | 1.49 | 1.14 | 0.474 | 0.462 | 0.817 | 0.932 | 0.629 | ||
| BGCv2LND.GSW | [-] | 141. | 133. | 114. | 8.95 | 0.0847 | 0.435 | 1.33 | 1.03 | 0.519 | 0.526 | 0.849 | 0.960 | 0.676 | ||
| BGCv2LNDATM | [-] | 150. | 141. | 114. | 8.35 | 0.0847 | 0.636 | 1.63 | 1.05 | 0.419 | 0.506 | 0.838 | 0.893 | 0.633 | ||
| CanESM5 | [-] | 143. | 130. | 114. | 10.3 | 0.770 | 1.88 | 1.60 | 0.442 | 0.420 | 0.708 | 0.947 | 0.587 | |||
| GFDL-ESM4 | [-] | 111. | 104. | 114. | 6.48 | -0.0456 | 1.63 | 1.45 | 0.495 | 0.401 | 0.710 | 0.944 | 0.590 | |||
| MeanCMIP6 | [-] | 117. | 110. | 114. | 7.12 | 0.131 | 1.28 | 1.15 | 0.554 | 0.491 | 0.769 | 0.946 | 0.650 | |||
| MIROC-ES2L | [-] | 113. | 101. | 114. | 9.78 | 0.119 | -0.0729 | 1.90 | 1.97 | 0.411 | 0.390 | 0.640 | 0.918 | 0.549 |
Download Data |
Period Mean (original grids) [Pg yr-1] |
Model Period Mean (intersection) [Pg yr-1] |
Benchmark Period Mean (intersection) [Pg yr-1] |
Model Period Mean (complement) [Pg yr-1] |
Benchmark Period Mean (complement) [Pg yr-1] |
Bias [g m-2 d-1] |
RMSE [g m-2 d-1] |
Phase Shift [months] |
Bias Score [1] |
RMSE Score [1] |
Seasonal Cycle Score [1] |
Spatial Distribution Score [1] |
Overall Score [1] |
|||
|---|---|---|---|---|---|---|---|---|---|---|---|---|---|---|---|---|
| Benchmark | [-] | 11.8 | ||||||||||||||
| BCC-CSM2-MR | [-] | 14.4 | 14.4 | 11.7 | 0.608 | 0.0581 | 0.279 | 0.958 | 0.380 | 0.758 | 0.651 | 0.964 | 0.936 | 0.792 | ||
| BGCv2LND.GSW | [-] | 19.3 | 18.6 | 11.7 | 0.689 | 0.0503 | 0.642 | 1.32 | 0.562 | 0.686 | 0.622 | 0.970 | 0.920 | 0.764 | ||
| BGCv2LNDATM | [-] | 15.4 | 14.9 | 11.7 | 0.556 | 0.0503 | 0.295 | 1.10 | 0.767 | 0.760 | 0.646 | 0.961 | 0.935 | 0.790 | ||
| CanESM5 | [-] | 15.5 | 15.0 | 11.8 | 0.743 | 0.387 | 1.37 | 0.907 | 0.715 | 0.524 | 0.934 | 0.878 | 0.715 | |||
| GFDL-ESM4 | [-] | 19.2 | 18.0 | 11.8 | 1.21 | 0.672 | 1.53 | 0.239 | 0.692 | 0.570 | 0.979 | 0.899 | 0.742 | |||
| MeanCMIP6 | [-] | 17.0 | 16.2 | 11.8 | 0.809 | 0.480 | 0.974 | 0.247 | 0.757 | 0.665 | 0.975 | 0.962 | 0.805 | |||
| MIROC-ES2L | [-] | 18.2 | 17.4 | 11.8 | 1.10 | 0.00324 | 0.577 | 1.43 | 0.758 | 0.661 | 0.565 | 0.936 | 0.811 | 0.708 |
Download Data |
Period Mean (original grids) [Pg yr-1] |
Model Period Mean (intersection) [Pg yr-1] |
Benchmark Period Mean (intersection) [Pg yr-1] |
Model Period Mean (complement) [Pg yr-1] |
Benchmark Period Mean (complement) [Pg yr-1] |
Bias [g m-2 d-1] |
RMSE [g m-2 d-1] |
Phase Shift [months] |
Bias Score [1] |
RMSE Score [1] |
Seasonal Cycle Score [1] |
Spatial Distribution Score [1] |
Overall Score [1] |
|||
|---|---|---|---|---|---|---|---|---|---|---|---|---|---|---|---|---|
| Benchmark | [-] | 21.8 | ||||||||||||||
| BCC-CSM2-MR | [-] | 16.7 | 16.4 | 21.8 | 0.285 | 0.0114 | -1.71 | 2.76 | 1.90 | 0.165 | 0.223 | 0.736 | 0.925 | 0.454 | ||
| BGCv2LND.GSW | [-] | 25.6 | 24.9 | 21.8 | 0.679 | 1.02 | 1.74 | 1.92 | 0.321 | 0.356 | 0.725 | 0.977 | 0.547 | |||
| BGCv2LNDATM | [-] | 30.2 | 29.5 | 21.8 | 0.679 | 2.56 | 3.06 | 1.96 | 0.101 | 0.332 | 0.702 | 0.920 | 0.477 | |||
| CanESM5 | [-] | 18.9 | 17.6 | 21.8 | 0.427 | -1.17 | 2.50 | 3.08 | 0.222 | 0.225 | 0.477 | 0.969 | 0.424 | |||
| GFDL-ESM4 | [-] | 18.7 | 18.5 | 21.8 | 0.239 | -1.04 | 2.98 | 2.99 | 0.201 | 0.167 | 0.509 | 0.757 | 0.360 | |||
| MeanCMIP6 | [-] | 17.4 | 17.0 | 21.8 | 0.319 | -1.46 | 2.13 | 2.74 | 0.223 | 0.277 | 0.561 | 0.916 | 0.451 | |||
| MIROC-ES2L | [-] | 16.4 | 15.2 | 21.8 | 0.524 | 0.00472 | -2.03 | 2.80 | 3.30 | 0.146 | 0.212 | 0.453 | 0.908 | 0.386 |
Download Data |
Period Mean (original grids) [Pg yr-1] |
Model Period Mean (intersection) [Pg yr-1] |
Benchmark Period Mean (intersection) [Pg yr-1] |
Model Period Mean (complement) [Pg yr-1] |
Benchmark Period Mean (complement) [Pg yr-1] |
Bias [g m-2 d-1] |
RMSE [g m-2 d-1] |
Phase Shift [months] |
Bias Score [1] |
RMSE Score [1] |
Seasonal Cycle Score [1] |
Spatial Distribution Score [1] |
Overall Score [1] |
|||
|---|---|---|---|---|---|---|---|---|---|---|---|---|---|---|---|---|
| Benchmark | [-] | 24.2 | ||||||||||||||
| BCC-CSM2-MR | [-] | 29.3 | 27.5 | 24.0 | 1.46 | 0.238 | 0.259 | 1.09 | 0.500 | 0.737 | 0.628 | 0.954 | 0.953 | 0.780 | ||
| BGCv2LND.GSW | [-] | 31.8 | 30.3 | 24.1 | 1.47 | 0.0710 | 0.365 | 1.22 | 0.641 | 0.698 | 0.639 | 0.964 | 0.934 | 0.775 | ||
| BGCv2LNDATM | [-] | 27.4 | 26.2 | 24.1 | 1.18 | 0.0710 | 0.124 | 1.16 | 0.616 | 0.726 | 0.632 | 0.966 | 0.945 | 0.780 | ||
| CanESM5 | [-] | 31.2 | 30.1 | 24.2 | 2.59 | 0.530 | 1.65 | 1.10 | 0.677 | 0.488 | 0.903 | 0.882 | 0.688 | |||
| GFDL-ESM4 | [-] | 28.9 | 27.2 | 24.2 | 1.75 | 0.268 | 1.41 | 0.469 | 0.706 | 0.567 | 0.951 | 0.898 | 0.738 | |||
| MeanCMIP6 | [-] | 31.3 | 29.4 | 24.2 | 1.90 | 0.417 | 1.08 | 0.519 | 0.744 | 0.642 | 0.959 | 0.962 | 0.790 | |||
| MIROC-ES2L | [-] | 34.6 | 32.2 | 24.2 | 3.55 | 0.0278 | 0.598 | 1.68 | 1.20 | 0.612 | 0.536 | 0.901 | 0.793 | 0.676 |
Temporally integrated period mean