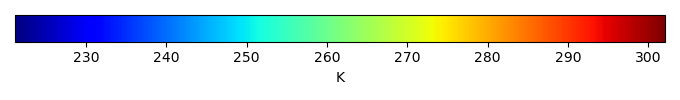
Mean State
Download Data |
Period Mean (original grids) [K] |
Model Period Mean (intersection) [K] |
Benchmark Period Mean (intersection) [K] |
Model Period Mean (complement) [K] |
Benchmark Period Mean (complement) [K] |
Bias [K] |
RMSE [K] |
Phase Shift [months] |
Bias Score [1] |
RMSE Score [1] |
Seasonal Cycle Score [1] |
Spatial Distribution Score [1] |
Overall Score [1] |
|||
|---|---|---|---|---|---|---|---|---|---|---|---|---|---|---|---|---|
| Benchmark | [-] | 298. | ||||||||||||||
| ACCESS-ESM1-5 | [-] | 299. | 299. | 298. | 300. | 0.853 | 1.63 | 0.856 | 0.404 | 0.551 | 0.898 | 0.933 | 0.667 | |||
| BCC-CSM2-MR | [-] | 298. | 298. | 298. | 301. | 0.105 | 1.33 | 0.934 | 0.508 | 0.516 | 0.882 | 0.999 | 0.684 | |||
| BGCLND | [-] | 298. | 298. | 298. | 299. | 299. | -0.108 | 0.829 | 0.371 | 0.589 | 0.750 | 0.963 | 1.00 | 0.810 | ||
| BGCLNDATM_progCO2 | [-] | 297. | 297. | 298. | 299. | 299. | -1.26 | 1.74 | 0.848 | 0.355 | 0.632 | 0.890 | 0.986 | 0.699 | ||
| CanESM5 | [-] | 298. | 298. | 298. | 301. | 0.0553 | 1.76 | 0.903 | 0.476 | 0.431 | 0.885 | 0.994 | 0.643 | |||
| CNRM-ESM2-1 | [-] | 298. | 298. | 298. | 299. | 0.403 | 2.01 | 1.03 | 0.369 | 0.419 | 0.854 | 0.955 | 0.603 | |||
| EC-Earth3-CC | [-] | 298. | 298. | 298. | 299. | -0.387 | 1.64 | 1.01 | 0.504 | 0.356 | 0.875 | 0.999 | 0.618 | |||
| MeanCMIP6 | [-] | 298. | 298. | 298. | 300. | -0.443 | 1.22 | 0.748 | 0.501 | 0.615 | 0.906 | 0.973 | 0.722 | |||
| MIROC-ES2L | [-] | 298. | 298. | 298. | 300. | -0.407 | 1.72 | 1.03 | 0.414 | 0.558 | 0.870 | 0.999 | 0.680 | |||
| MPI-ESM1-2-LR | [-] | 297. | 298. | 298. | 299. | -0.393 | 1.85 | 0.797 | 0.413 | 0.434 | 0.902 | 0.999 | 0.636 | |||
| MRI-ESM2-0 | [-] | 298. | 298. | 298. | 300. | 0.396 | 1.43 | 1.05 | 0.478 | 0.475 | 0.857 | 1.00 | 0.657 | |||
| NorESM2-LM | [-] | 299. | 299. | 298. | 300. | 0.743 | 1.68 | 1.10 | 0.441 | 0.514 | 0.870 | 0.972 | 0.662 | |||
| UKESM1-0-LL | [-] | 299. | 299. | 298. | 300. | 0.756 | 1.67 | 0.724 | 0.406 | 0.516 | 0.920 | 1.00 | 0.671 |
Download Data |
Period Mean (original grids) [K] |
Model Period Mean (intersection) [K] |
Benchmark Period Mean (intersection) [K] |
Model Period Mean (complement) [K] |
Benchmark Period Mean (complement) [K] |
Bias [K] |
RMSE [K] |
Phase Shift [months] |
Bias Score [1] |
RMSE Score [1] |
Seasonal Cycle Score [1] |
Spatial Distribution Score [1] |
Overall Score [1] |
|||
|---|---|---|---|---|---|---|---|---|---|---|---|---|---|---|---|---|
| Benchmark | [-] | 299. | ||||||||||||||
| ACCESS-ESM1-5 | [-] | 301. | 301. | 299. | 302. | 1.99 | 2.16 | 1.99 | 0.125 | 0.438 | 0.706 | 0.880 | 0.518 | |||
| BCC-CSM2-MR | [-] | 300. | 299. | 299. | 302. | 1.16 | 2.05 | 1.97 | 0.153 | 0.481 | 0.709 | 0.895 | 0.544 | |||
| BGCLND | [-] | 299. | 299. | 299. | 299. | 300. | -0.118 | 0.896 | 0.929 | 0.330 | 0.704 | 0.863 | 0.945 | 0.709 | ||
| BGCLNDATM_progCO2 | [-] | 299. | 298. | 299. | 300. | 300. | -0.729 | 1.48 | 1.74 | 0.209 | 0.649 | 0.747 | 1.00 | 0.651 | ||
| CanESM5 | [-] | 300. | 299. | 299. | 301. | 1.13 | 1.81 | 1.72 | 0.163 | 0.523 | 0.728 | 0.996 | 0.587 | |||
| CNRM-ESM2-1 | [-] | 297. | 297. | 299. | 299. | -1.22 | 1.74 | 2.12 | 0.186 | 0.515 | 0.665 | 0.932 | 0.563 | |||
| EC-Earth3-CC | [-] | 299. | 298. | 299. | 300. | -1.03 | 1.66 | 2.15 | 0.190 | 0.467 | 0.661 | 0.921 | 0.541 | |||
| MeanCMIP6 | [-] | 299. | 299. | 299. | 301. | 0.394 | 1.44 | 1.16 | 0.226 | 0.639 | 0.831 | 0.998 | 0.667 | |||
| MIROC-ES2L | [-] | 299. | 298. | 299. | 300. | -0.0194 | 1.61 | 1.45 | 0.205 | 0.378 | 0.810 | 0.981 | 0.550 | |||
| MPI-ESM1-2-LR | [-] | 297. | 297. | 299. | 299. | -0.557 | 1.84 | 1.46 | 0.176 | 0.497 | 0.799 | 0.962 | 0.586 | |||
| MRI-ESM2-0 | [-] | 299. | 299. | 299. | 301. | 0.268 | 1.45 | 1.60 | 0.233 | 0.526 | 0.760 | 0.960 | 0.601 | |||
| NorESM2-LM | [-] | 300. | 300. | 299. | 301. | 0.923 | 1.51 | 1.92 | 0.228 | 0.547 | 0.726 | 0.947 | 0.599 | |||
| UKESM1-0-LL | [-] | 299. | 299. | 299. | 301. | 0.644 | 1.53 | 1.57 | 0.225 | 0.418 | 0.769 | 1.00 | 0.566 |
Download Data |
Period Mean (original grids) [K] |
Model Period Mean (intersection) [K] |
Benchmark Period Mean (intersection) [K] |
Model Period Mean (complement) [K] |
Benchmark Period Mean (complement) [K] |
Bias [K] |
RMSE [K] |
Phase Shift [months] |
Bias Score [1] |
RMSE Score [1] |
Seasonal Cycle Score [1] |
Spatial Distribution Score [1] |
Overall Score [1] |
|||
|---|---|---|---|---|---|---|---|---|---|---|---|---|---|---|---|---|
| Benchmark | [-] | 287. | ||||||||||||||
| ACCESS-ESM1-5 | [-] | 283. | 287. | 287. | 249. | 0.596 | 2.55 | 0.496 | 0.686 | 0.726 | 0.944 | 0.999 | 0.816 | |||
| BCC-CSM2-MR | [-] | 282. | 286. | 287. | 248. | -0.363 | 2.36 | 0.529 | 0.716 | 0.739 | 0.939 | 0.999 | 0.826 | |||
| BGCLND | [-] | 282. | 286. | 287. | 248. | 284. | -0.417 | 1.16 | 0.194 | 0.804 | 0.883 | 0.979 | 1.00 | 0.910 | ||
| BGCLNDATM_progCO2 | [-] | 282. | 287. | 287. | 247. | 284. | -0.213 | 2.36 | 0.399 | 0.690 | 0.784 | 0.955 | 0.988 | 0.840 | ||
| CanESM5 | [-] | 282. | 286. | 287. | 249. | -0.0366 | 2.84 | 0.547 | 0.678 | 0.698 | 0.935 | 1.00 | 0.802 | |||
| CNRM-ESM2-1 | [-] | 282. | 286. | 287. | 246. | -0.232 | 2.45 | 0.555 | 0.687 | 0.735 | 0.940 | 0.999 | 0.819 | |||
| EC-Earth3-CC | [-] | 283. | 286. | 287. | 268. | -0.350 | 2.28 | 0.591 | 0.721 | 0.712 | 0.934 | 0.999 | 0.816 | |||
| MeanCMIP6 | [-] | 280. | 284. | 287. | 254. | -2.75 | 4.34 | 0.401 | 0.577 | 0.701 | 0.956 | 0.983 | 0.783 | |||
| MIROC-ES2L | [-] | 284. | 288. | 287. | 260. | 1.21 | 2.94 | 0.523 | 0.647 | 0.740 | 0.940 | 0.999 | 0.813 | |||
| MPI-ESM1-2-LR | [-] | 282. | 286. | 287. | 246. | -0.236 | 2.43 | 0.475 | 0.686 | 0.732 | 0.948 | 0.999 | 0.820 | |||
| MRI-ESM2-0 | [-] | 283. | 287. | 287. | 246. | 0.608 | 2.24 | 0.524 | 0.725 | 0.738 | 0.939 | 0.998 | 0.828 | |||
| NorESM2-LM | [-] | 283. | 287. | 287. | 248. | 0.786 | 2.63 | 0.614 | 0.692 | 0.739 | 0.938 | 1.00 | 0.822 | |||
| UKESM1-0-LL | [-] | 281. | 285. | 287. | 245. | -0.994 | 2.50 | 0.488 | 0.692 | 0.737 | 0.946 | 0.994 | 0.821 |
Download Data |
Period Mean (original grids) [K] |
Model Period Mean (intersection) [K] |
Benchmark Period Mean (intersection) [K] |
Model Period Mean (complement) [K] |
Benchmark Period Mean (complement) [K] |
Bias [K] |
RMSE [K] |
Phase Shift [months] |
Bias Score [1] |
RMSE Score [1] |
Seasonal Cycle Score [1] |
Spatial Distribution Score [1] |
Overall Score [1] |
|||
|---|---|---|---|---|---|---|---|---|---|---|---|---|---|---|---|---|
| Benchmark | [-] | 268. | ||||||||||||||
| ACCESS-ESM1-5 | [-] | 269. | 270. | 268. | 267. | 1.16 | 3.18 | 0.0976 | 0.867 | 0.827 | 0.992 | 1.00 | 0.903 | |||
| BCC-CSM2-MR | [-] | 267. | 267. | 268. | 266. | -1.08 | 3.19 | 0.106 | 0.857 | 0.831 | 0.992 | 0.991 | 0.900 | |||
| BGCLND | [-] | 268. | 268. | 268. | 268. | 270. | -0.883 | 1.58 | 0.0240 | 0.900 | 0.928 | 0.998 | 0.999 | 0.951 | ||
| BGCLNDATM_progCO2 | [-] | 270. | 270. | 268. | 270. | 270. | 1.80 | 3.41 | 0.0400 | 0.857 | 0.829 | 0.997 | 0.974 | 0.897 | ||
| CanESM5 | [-] | 269. | 269. | 268. | 268. | 0.585 | 2.99 | 0.0953 | 0.858 | 0.847 | 0.994 | 0.995 | 0.908 | |||
| CNRM-ESM2-1 | [-] | 270. | 270. | 268. | 269. | 1.25 | 2.97 | 0.0780 | 0.856 | 0.844 | 0.995 | 0.995 | 0.907 | |||
| EC-Earth3-CC | [-] | 270. | 269. | 268. | 272. | 0.129 | 2.83 | 0.0978 | 0.880 | 0.843 | 0.993 | 0.998 | 0.912 | |||
| MeanCMIP6 | [-] | 263. | 263. | 269. | 264. | -5.61 | 7.38 | 0.0513 | 0.641 | 0.696 | 0.997 | 0.999 | 0.806 | |||
| MIROC-ES2L | [-] | 270. | 270. | 268. | 270. | 1.60 | 3.64 | 0.0542 | 0.815 | 0.834 | 0.996 | 0.992 | 0.894 | |||
| MPI-ESM1-2-LR | [-] | 268. | 268. | 268. | 267. | 0.0526 | 2.86 | 0.0971 | 0.868 | 0.851 | 0.993 | 0.997 | 0.912 | |||
| MRI-ESM2-0 | [-] | 270. | 270. | 268. | 270. | 1.71 | 3.05 | 0.0698 | 0.856 | 0.848 | 0.995 | 0.994 | 0.908 | |||
| NorESM2-LM | [-] | 270. | 269. | 268. | 268. | 0.856 | 3.55 | 0.308 | 0.866 | 0.805 | 0.979 | 1.00 | 0.891 | |||
| UKESM1-0-LL | [-] | 266. | 266. | 268. | 265. | -2.62 | 3.68 | 0.0831 | 0.800 | 0.832 | 0.994 | 0.992 | 0.890 |
Download Data |
Period Mean (original grids) [K] |
Model Period Mean (intersection) [K] |
Benchmark Period Mean (intersection) [K] |
Model Period Mean (complement) [K] |
Benchmark Period Mean (complement) [K] |
Bias [K] |
RMSE [K] |
Phase Shift [months] |
Bias Score [1] |
RMSE Score [1] |
Seasonal Cycle Score [1] |
Spatial Distribution Score [1] |
Overall Score [1] |
|||
|---|---|---|---|---|---|---|---|---|---|---|---|---|---|---|---|---|
| Benchmark | [-] | 299. | ||||||||||||||
| ACCESS-ESM1-5 | [-] | 300. | 300. | 299. | 300. | 1.50 | 2.42 | 1.38 | 0.201 | 0.290 | 0.807 | 1.00 | 0.518 | |||
| BCC-CSM2-MR | [-] | 299. | 299. | 299. | 300. | 0.345 | 1.76 | 1.75 | 0.318 | 0.410 | 0.747 | 0.979 | 0.573 | |||
| BGCLND | [-] | 298. | 298. | 299. | 300. | 301. | -0.590 | 0.997 | 0.658 | 0.448 | 0.712 | 0.912 | 1.00 | 0.756 | ||
| BGCLNDATM_progCO2 | [-] | 297. | 297. | 299. | 299. | 301. | -1.95 | 2.37 | 1.14 | 0.123 | 0.581 | 0.852 | 0.942 | 0.616 | ||
| CanESM5 | [-] | 300. | 300. | 299. | 301. | 1.40 | 3.28 | 1.38 | 0.165 | 0.191 | 0.796 | 0.787 | 0.426 | |||
| CNRM-ESM2-1 | [-] | 298. | 298. | 299. | 299. | -1.22 | 1.95 | 1.20 | 0.262 | 0.328 | 0.846 | 0.987 | 0.550 | |||
| EC-Earth3-CC | [-] | 299. | 299. | 299. | 299. | -0.437 | 2.10 | 1.34 | 0.319 | 0.277 | 0.808 | 0.956 | 0.528 | |||
| MeanCMIP6 | [-] | 299. | 299. | 299. | 299. | -0.225 | 1.36 | 1.21 | 0.464 | 0.537 | 0.842 | 1.00 | 0.676 | |||
| MIROC-ES2L | [-] | 298. | 298. | 299. | 299. | -1.05 | 2.29 | 1.97 | 0.267 | 0.372 | 0.725 | 1.00 | 0.547 | |||
| MPI-ESM1-2-LR | [-] | 298. | 298. | 299. | 300. | -1.29 | 2.46 | 1.30 | 0.228 | 0.318 | 0.825 | 0.981 | 0.534 | |||
| MRI-ESM2-0 | [-] | 298. | 298. | 299. | 300. | -0.565 | 1.48 | 1.53 | 0.385 | 0.408 | 0.776 | 0.998 | 0.595 | |||
| NorESM2-LM | [-] | 299. | 299. | 299. | 300. | -0.373 | 1.57 | 1.13 | 0.432 | 0.419 | 0.852 | 0.979 | 0.620 | |||
| UKESM1-0-LL | [-] | 299. | 299. | 299. | 299. | 0.153 | 1.86 | 1.56 | 0.339 | 0.313 | 0.757 | 1.00 | 0.544 |
Download Data |
Period Mean (original grids) [K] |
Model Period Mean (intersection) [K] |
Benchmark Period Mean (intersection) [K] |
Model Period Mean (complement) [K] |
Benchmark Period Mean (complement) [K] |
Bias [K] |
RMSE [K] |
Phase Shift [months] |
Bias Score [1] |
RMSE Score [1] |
Seasonal Cycle Score [1] |
Spatial Distribution Score [1] |
Overall Score [1] |
|||
|---|---|---|---|---|---|---|---|---|---|---|---|---|---|---|---|---|
| Benchmark | [-] | 276. | ||||||||||||||
| ACCESS-ESM1-5 | [-] | 277. | 277. | 276. | 282. | 1.19 | 2.89 | 0.107 | 0.843 | 0.841 | 0.992 | 0.998 | 0.903 | |||
| BCC-CSM2-MR | [-] | 275. | 275. | 276. | 279. | -1.13 | 2.81 | 0.119 | 0.846 | 0.844 | 0.992 | 1.00 | 0.905 | |||
| BGCLND | [-] | 276. | 276. | 276. | 282. | 281. | -0.616 | 1.34 | 0.0497 | 0.905 | 0.938 | 0.997 | 0.999 | 0.956 | ||
| BGCLNDATM_progCO2 | [-] | 277. | 277. | 276. | 283. | 281. | 0.553 | 2.55 | 0.0962 | 0.872 | 0.857 | 0.994 | 0.985 | 0.913 | ||
| CanESM5 | [-] | 276. | 276. | 276. | 280. | 0.132 | 3.01 | 0.138 | 0.830 | 0.844 | 0.991 | 0.999 | 0.901 | |||
| CNRM-ESM2-1 | [-] | 276. | 276. | 276. | 282. | 0.492 | 2.73 | 0.199 | 0.832 | 0.863 | 0.987 | 0.997 | 0.908 | |||
| EC-Earth3-CC | [-] | 279. | 276. | 276. | 284. | -0.172 | 2.42 | 0.215 | 0.874 | 0.854 | 0.986 | 0.999 | 0.913 | |||
| MeanCMIP6 | [-] | 271. | 271. | 276. | 278. | -5.21 | 6.57 | 0.0779 | 0.633 | 0.711 | 0.995 | 0.989 | 0.808 | |||
| MIROC-ES2L | [-] | 278. | 278. | 276. | 281. | 1.75 | 3.45 | 0.0861 | 0.793 | 0.848 | 0.994 | 0.999 | 0.896 | |||
| MPI-ESM1-2-LR | [-] | 276. | 276. | 276. | 277. | 0.143 | 2.56 | 0.157 | 0.851 | 0.867 | 0.989 | 1.00 | 0.915 | |||
| MRI-ESM2-0 | [-] | 277. | 277. | 276. | 284. | 0.936 | 2.50 | 0.104 | 0.859 | 0.863 | 0.993 | 0.995 | 0.915 | |||
| NorESM2-LM | [-] | 278. | 277. | 276. | 280. | 1.26 | 3.06 | 0.343 | 0.840 | 0.835 | 0.977 | 1.00 | 0.898 | |||
| UKESM1-0-LL | [-] | 274. | 274. | 276. | 278. | -1.69 | 2.95 | 0.148 | 0.826 | 0.846 | 0.990 | 0.994 | 0.901 |
Temporally integrated period mean