Mean State
Download Data |
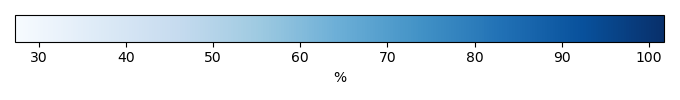
Period Mean (original grids) [%] |
Model Period Mean (intersection) [%] |
Benchmark Period Mean (intersection) [%] |
Model Period Mean (complement) [%] |
Benchmark Period Mean (complement) [%] |
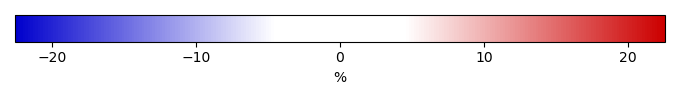
Bias [%] |
RMSE [%] |
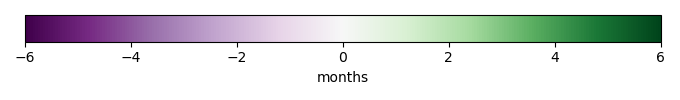
Phase Shift [months] |
Bias Score [1] |
RMSE Score [1] |
Seasonal Cycle Score [1] |
Spatial Distribution Score [1] |
Overall Score [1] |
|||
|---|---|---|---|---|---|---|---|---|---|---|---|---|---|---|---|---|
| Benchmark | [-] | 73.1 | ||||||||||||||
| ACCESS-ESM1-5 | [-] | 68.8 | 69.0 | 73.1 | -0.296 | 18.3 | 2.43 | 0.0780 | 0.239 | 0.592 | 0.617 | 0.353 | ||||
| BCC-CSM2-MR | [-] | 70.4 | 70.4 | 73.6 | -4.06 | 21.8 | 2.36 | 0.0618 | 0.299 | 0.588 | 0.512 | 0.352 | ||||
| BGCLND | [-] | 66.9 | 66.9 | 55.0 | 94.9 | 11.8 | 16.4 | 1.82 | 0.221 | 0.264 | 0.722 | 0.800 | 0.454 | |||
| BGCLNDATM_progCO2 | [-] | 74.9 | 74.9 | 55.0 | 94.9 | 19.9 | 21.3 | 1.74 | 0.0907 | 0.426 | 0.736 | 0.887 | 0.513 | |||
| CanESM5 | [-] | 73.8 | 74.3 | 73.1 | 9.35 | 14.2 | 2.44 | 0.0942 | 0.252 | 0.586 | 0.818 | 0.400 | ||||
| CNRM-ESM2-1 | [-] | 58.3 | 57.4 | 73.1 | -4.68 | 14.7 | 2.78 | 0.113 | 0.277 | 0.508 | 0.950 | 0.425 | ||||
| EC-Earth3-CC | [-] | 71.9 | 71.9 | 73.1 | -1.20 | 16.5 | 2.54 | 0.118 | 0.159 | 0.540 | 0.768 | 0.349 | ||||
| MeanCMIP6 | [-] | 71.9 | 71.3 | 73.1 | 3.05 | 16.1 | 2.68 | 0.0572 | 0.385 | 0.493 | 0.636 | 0.391 | ||||
| MIROC-ES2L | [-] | 73.8 | 74.5 | 73.1 | 3.33 | 19.1 | 2.74 | 0.0530 | 0.437 | 0.476 | 0.643 | 0.409 | ||||
| MPI-ESM1-2-LR | [-] | 66.9 | 64.9 | 73.1 | -4.02 | 18.5 | 2.59 | 0.115 | 0.294 | 0.510 | 0.750 | 0.392 | ||||
| MRI-ESM2-0 | [-] | 68.3 | 68.3 | 73.6 | 1.31 | 15.6 | 1.97 | 0.0889 | 0.216 | 0.692 | 0.711 | 0.385 | ||||
| NorESM2-LM | [-] | 63.5 | 62.0 | 73.1 | -3.52 | 14.3 | 1.91 | 0.149 | 0.344 | 0.695 | 0.799 | 0.466 | ||||
| UKESM1-0-LL | [-] | 64.0 | 63.2 | 73.1 | -3.58 | 15.4 | 2.70 | 0.108 | 0.359 | 0.478 | 0.727 | 0.406 |
Download Data |
Period Mean (original grids) [%] |
Model Period Mean (intersection) [%] |
Benchmark Period Mean (intersection) [%] |
Model Period Mean (complement) [%] |
Benchmark Period Mean (complement) [%] |
Bias [%] |
RMSE [%] |
Phase Shift [months] |
Bias Score [1] |
RMSE Score [1] |
Seasonal Cycle Score [1] |
Spatial Distribution Score [1] |
Overall Score [1] |
|||
|---|---|---|---|---|---|---|---|---|---|---|---|---|---|---|---|---|
| Benchmark | [-] | 85.2 | ||||||||||||||
| ACCESS-ESM1-5 | [-] | 87.4 | 87.5 | 85.2 | -5.82 | 19.2 | 2.26 | 0.00202 | 0.351 | 0.648 | 0.434 | 0.357 | ||||
| BCC-CSM2-MR | [-] | 82.5 | 82.5 | 85.1 | -12.6 | 22.5 | 2.41 | 0.0163 | 0.402 | 0.629 | 0.568 | 0.403 | ||||
| BGCLND | [-] | 85.4 | 85.4 | 67.1 | 94.5 | 18.4 | 20.7 | 2.13 | 0.00182 | 0.432 | 0.676 | 0.342 | 0.377 | |||
| BGCLNDATM_progCO2 | [-] | 85.7 | 85.7 | 67.1 | 94.5 | 18.6 | 21.1 | 2.05 | 0.00224 | 0.502 | 0.685 | 0.426 | 0.423 | |||
| CanESM5 | [-] | 91.5 | 91.6 | 85.2 | 6.98 | 10.7 | 2.14 | 0.0983 | 0.436 | 0.675 | 0.0457 | 0.338 | ||||
| CNRM-ESM2-1 | [-] | 84.3 | 84.2 | 85.2 | -3.49 | 15.8 | 2.08 | 0.00183 | 0.238 | 0.667 | 0.225 | 0.274 | ||||
| EC-Earth3-CC | [-] | 83.3 | 83.4 | 85.2 | -1.84 | 14.6 | 2.12 | 0.000968 | 0.334 | 0.678 | 0.108 | 0.291 | ||||
| MeanCMIP6 | [-] | 87.2 | 87.1 | 85.2 | -1.33 | 15.5 | 1.98 | 0.000426 | 0.480 | 0.690 | 0.147 | 0.359 | ||||
| MIROC-ES2L | [-] | 88.6 | 88.9 | 85.2 | -0.933 | 16.4 | 2.77 | 0.00543 | 0.311 | 0.533 | 0.380 | 0.308 | ||||
| MPI-ESM1-2-LR | [-] | 83.2 | 82.8 | 85.2 | -9.67 | 19.3 | 1.86 | 0.00574 | 0.356 | 0.728 | 0.342 | 0.357 | ||||
| MRI-ESM2-0 | [-] | 88.5 | 88.5 | 85.1 | -0.909 | 15.7 | 2.18 | 0.000779 | 0.360 | 0.666 | 0.216 | 0.321 | ||||
| NorESM2-LM | [-] | 82.8 | 82.7 | 85.2 | -4.68 | 16.1 | 2.27 | 0.00121 | 0.401 | 0.648 | 0.110 | 0.312 | ||||
| UKESM1-0-LL | [-] | 82.0 | 82.0 | 85.2 | -8.35 | 18.7 | 2.21 | 0.00398 | 0.347 | 0.657 | 0.270 | 0.325 |
Download Data |
Period Mean (original grids) [%] |
Model Period Mean (intersection) [%] |
Benchmark Period Mean (intersection) [%] |
Model Period Mean (complement) [%] |
Benchmark Period Mean (complement) [%] |
Bias [%] |
RMSE [%] |
Phase Shift [months] |
Bias Score [1] |
RMSE Score [1] |
Seasonal Cycle Score [1] |
Spatial Distribution Score [1] |
Overall Score [1] |
|||
|---|---|---|---|---|---|---|---|---|---|---|---|---|---|---|---|---|
| Benchmark | [-] | 62.5 | ||||||||||||||
| ACCESS-ESM1-5 | [-] | 72.1 | 72.1 | 62.5 | 10.9 | 17.9 | 1.98 | 0.250 | 0.431 | 0.652 | 0.984 | 0.550 | ||||
| BCC-CSM2-MR | [-] | 68.6 | 68.6 | 62.5 | 6.62 | 15.3 | 1.82 | 0.323 | 0.463 | 0.688 | 0.974 | 0.582 | ||||
| BGCLND | [-] | 71.9 | 71.9 | 60.1 | 92.2 | 11.8 | 15.4 | 1.41 | 0.329 | 0.512 | 0.779 | 0.952 | 0.617 | |||
| BGCLNDATM_progCO2 | [-] | 74.0 | 74.0 | 60.1 | 92.2 | 13.9 | 16.9 | 1.59 | 0.284 | 0.519 | 0.727 | 0.917 | 0.593 | |||
| CanESM5 | [-] | 69.2 | 69.0 | 62.5 | 9.27 | 16.3 | 1.72 | 0.311 | 0.436 | 0.732 | 0.911 | 0.565 | ||||
| CNRM-ESM2-1 | [-] | 62.9 | 62.8 | 62.5 | 2.37 | 14.7 | 1.71 | 0.362 | 0.461 | 0.729 | 0.906 | 0.584 | ||||
| EC-Earth3-CC | [-] | 64.8 | 64.8 | 62.5 | 2.32 | 15.9 | 1.80 | 0.337 | 0.425 | 0.703 | 0.839 | 0.546 | ||||
| MeanCMIP6 | [-] | 69.9 | 69.9 | 62.5 | 8.92 | 14.5 | 1.74 | 0.301 | 0.525 | 0.691 | 0.977 | 0.604 | ||||
| MIROC-ES2L | [-] | 68.6 | 68.6 | 62.5 | 7.49 | 15.9 | 1.86 | 0.299 | 0.499 | 0.671 | 0.984 | 0.590 | ||||
| MPI-ESM1-2-LR | [-] | 69.1 | 69.1 | 62.5 | 7.96 | 16.3 | 1.82 | 0.269 | 0.474 | 0.689 | 0.983 | 0.578 | ||||
| MRI-ESM2-0 | [-] | 68.5 | 68.5 | 62.5 | 7.64 | 15.2 | 1.79 | 0.313 | 0.469 | 0.697 | 0.985 | 0.586 | ||||
| NorESM2-LM | [-] | 66.7 | 66.7 | 62.5 | 6.11 | 14.0 | 1.87 | 0.348 | 0.471 | 0.671 | 0.990 | 0.590 | ||||
| UKESM1-0-LL | [-] | 69.6 | 69.6 | 62.5 | 8.51 | 15.6 | 1.84 | 0.293 | 0.513 | 0.676 | 0.970 | 0.593 |
Download Data |
Period Mean (original grids) [%] |
Model Period Mean (intersection) [%] |
Benchmark Period Mean (intersection) [%] |
Model Period Mean (complement) [%] |
Benchmark Period Mean (complement) [%] |
Bias [%] |
RMSE [%] |
Phase Shift [months] |
Bias Score [1] |
RMSE Score [1] |
Seasonal Cycle Score [1] |
Spatial Distribution Score [1] |
Overall Score [1] |
|||
|---|---|---|---|---|---|---|---|---|---|---|---|---|---|---|---|---|
| Benchmark | [-] | 84.0 | ||||||||||||||
| ACCESS-ESM1-5 | [-] | 92.0 | 91.6 | 84.0 | 6.54 | 15.3 | 2.73 | 0.256 | 0.488 | 0.555 | 0.742 | 0.506 | ||||
| BCC-CSM2-MR | [-] | 87.8 | 87.6 | 84.0 | 4.41 | 16.7 | 2.80 | 0.287 | 0.560 | 0.555 | 0.990 | 0.591 | ||||
| BGCLND | [-] | 87.3 | 87.3 | 76.3 | 94.6 | 11.0 | 14.2 | 1.67 | 0.539 | 0.623 | 0.766 | 0.733 | 0.657 | |||
| BGCLNDATM_progCO2 | [-] | 88.6 | 88.6 | 76.3 | 94.6 | 12.3 | 15.5 | 1.86 | 0.502 | 0.579 | 0.738 | 0.604 | 0.600 | |||
| CanESM5 | [-] | 82.3 | 82.2 | 84.0 | 3.86 | 8.83 | 2.43 | 0.556 | 0.529 | 0.611 | 0.790 | 0.603 | ||||
| CNRM-ESM2-1 | [-] | 78.6 | 78.4 | 84.0 | -1.73 | 11.0 | 3.07 | 0.400 | 0.568 | 0.476 | 0.863 | 0.575 | ||||
| EC-Earth3-CC | [-] | 79.1 | 79.1 | 84.0 | -4.86 | 13.8 | 3.97 | 0.362 | 0.484 | 0.311 | 0.474 | 0.423 | ||||
| MeanCMIP6 | [-] | 86.6 | 86.6 | 84.0 | 4.67 | 11.4 | 2.38 | 0.329 | 0.587 | 0.638 | 0.754 | 0.579 | ||||
| MIROC-ES2L | [-] | 86.0 | 85.9 | 84.0 | 4.55 | 13.5 | 2.23 | 0.311 | 0.572 | 0.663 | 0.959 | 0.616 | ||||
| MPI-ESM1-2-LR | [-] | 91.6 | 91.4 | 84.0 | 9.13 | 15.1 | 2.61 | 0.240 | 0.571 | 0.592 | 0.913 | 0.577 | ||||
| MRI-ESM2-0 | [-] | 87.5 | 87.3 | 84.0 | 5.00 | 11.9 | 2.29 | 0.330 | 0.567 | 0.651 | 0.676 | 0.558 | ||||
| NorESM2-LM | [-] | 84.7 | 85.2 | 84.0 | 3.19 | 13.6 | 2.30 | 0.332 | 0.524 | 0.640 | 0.969 | 0.598 | ||||
| UKESM1-0-LL | [-] | 87.9 | 87.9 | 84.0 | 4.68 | 13.8 | 2.54 | 0.308 | 0.567 | 0.602 | 0.901 | 0.589 |
Download Data |
Period Mean (original grids) [%] |
Model Period Mean (intersection) [%] |
Benchmark Period Mean (intersection) [%] |
Model Period Mean (complement) [%] |
Benchmark Period Mean (complement) [%] |
Bias [%] |
RMSE [%] |
Phase Shift [months] |
Bias Score [1] |
RMSE Score [1] |
Seasonal Cycle Score [1] |
Spatial Distribution Score [1] |
Overall Score [1] |
|||
|---|---|---|---|---|---|---|---|---|---|---|---|---|---|---|---|---|
| Benchmark | [-] | 64.8 | ||||||||||||||
| ACCESS-ESM1-5 | [-] | 79.0 | 79.0 | 64.8 | 14.3 | 21.5 | 1.87 | 0.125 | 0.196 | 0.720 | 0.846 | 0.416 | ||||
| BCC-CSM2-MR | [-] | 72.4 | 72.4 | 64.8 | 7.71 | 14.6 | 1.63 | 0.213 | 0.126 | 0.763 | 0.991 | 0.444 | ||||
| BGCLND | [-] | 82.3 | 82.3 | 63.7 | 93.9 | 18.6 | 20.2 | 1.68 | 0.0335 | 0.270 | 0.766 | 0.937 | 0.455 | |||
| BGCLNDATM_progCO2 | [-] | 84.2 | 84.2 | 63.7 | 93.9 | 20.5 | 21.6 | 1.27 | 0.0133 | 0.349 | 0.835 | 0.996 | 0.509 | |||
| CanESM5 | [-] | 71.7 | 71.4 | 64.8 | 7.98 | 18.2 | 1.63 | 0.153 | 0.0783 | 0.766 | 0.859 | 0.387 | ||||
| CNRM-ESM2-1 | [-] | 74.5 | 74.5 | 64.8 | 10.1 | 16.1 | 1.43 | 0.111 | 0.121 | 0.792 | 0.983 | 0.426 | ||||
| EC-Earth3-CC | [-] | 76.8 | 76.9 | 64.8 | 12.0 | 18.5 | 1.46 | 0.146 | 0.208 | 0.796 | 0.936 | 0.459 | ||||
| MeanCMIP6 | [-] | 77.9 | 77.9 | 64.7 | 13.4 | 17.1 | 1.53 | 0.0624 | 0.177 | 0.780 | 0.967 | 0.433 | ||||
| MIROC-ES2L | [-] | 84.2 | 84.5 | 64.8 | 19.6 | 23.2 | 1.65 | 0.0244 | 0.211 | 0.758 | 0.994 | 0.440 | ||||
| MPI-ESM1-2-LR | [-] | 78.2 | 78.1 | 64.8 | 13.2 | 17.9 | 1.57 | 0.102 | 0.226 | 0.778 | 0.981 | 0.463 | ||||
| MRI-ESM2-0 | [-] | 84.8 | 84.8 | 64.8 | 19.9 | 22.0 | 1.24 | 0.0208 | 0.261 | 0.827 | 0.985 | 0.471 | ||||
| NorESM2-LM | [-] | 76.4 | 76.4 | 64.8 | 11.8 | 16.2 | 1.41 | 0.0564 | 0.122 | 0.795 | 0.818 | 0.383 | ||||
| UKESM1-0-LL | [-] | 76.4 | 76.4 | 64.8 | 11.8 | 16.1 | 1.58 | 0.106 | 0.240 | 0.770 | 0.979 | 0.467 |
Download Data |
Period Mean (original grids) [%] |
Model Period Mean (intersection) [%] |
Benchmark Period Mean (intersection) [%] |
Model Period Mean (complement) [%] |
Benchmark Period Mean (complement) [%] |
Bias [%] |
RMSE [%] |
Phase Shift [months] |
Bias Score [1] |
RMSE Score [1] |
Seasonal Cycle Score [1] |
Spatial Distribution Score [1] |
Overall Score [1] |
|||
|---|---|---|---|---|---|---|---|---|---|---|---|---|---|---|---|---|
| Benchmark | [-] | 77.8 | ||||||||||||||
| ACCESS-ESM1-5 | [-] | 80.2 | 79.9 | 77.8 | 3.20 | 16.6 | 3.13 | 0.212 | 0.521 | 0.431 | 0.800 | 0.497 | ||||
| BCC-CSM2-MR | [-] | 76.9 | 76.9 | 77.8 | -2.16 | 19.4 | 3.16 | 0.267 | 0.562 | 0.431 | 0.823 | 0.529 | ||||
| BGCLND | [-] | 77.0 | 77.0 | 66.1 | 94.4 | 10.8 | 14.9 | 1.20 | 0.506 | 0.640 | 0.848 | 0.947 | 0.716 | |||
| BGCLNDATM_progCO2 | [-] | 79.1 | 79.1 | 66.1 | 94.4 | 12.9 | 16.6 | 1.34 | 0.466 | 0.595 | 0.830 | 0.861 | 0.669 | |||
| CanESM5 | [-] | 74.8 | 74.3 | 77.8 | 4.50 | 10.2 | 2.48 | 0.425 | 0.545 | 0.587 | 0.834 | 0.587 | ||||
| CNRM-ESM2-1 | [-] | 69.6 | 69.5 | 77.8 | -3.01 | 13.5 | 3.08 | 0.319 | 0.586 | 0.444 | 0.778 | 0.543 | ||||
| EC-Earth3-CC | [-] | 73.4 | 73.4 | 77.8 | -4.41 | 14.5 | 3.57 | 0.321 | 0.528 | 0.353 | 0.795 | 0.505 | ||||
| MeanCMIP6 | [-] | 76.0 | 76.0 | 77.8 | 2.02 | 12.8 | 2.89 | 0.270 | 0.620 | 0.487 | 0.744 | 0.548 | ||||
| MIROC-ES2L | [-] | 75.2 | 74.5 | 77.8 | 0.613 | 13.8 | 2.72 | 0.277 | 0.615 | 0.520 | 0.839 | 0.573 | ||||
| MPI-ESM1-2-LR | [-] | 79.2 | 78.8 | 77.8 | 3.51 | 15.5 | 2.94 | 0.224 | 0.580 | 0.474 | 0.897 | 0.551 | ||||
| MRI-ESM2-0 | [-] | 75.7 | 75.6 | 77.8 | 2.08 | 13.5 | 2.91 | 0.261 | 0.582 | 0.485 | 0.841 | 0.550 | ||||
| NorESM2-LM | [-] | 69.8 | 70.7 | 77.8 | -2.84 | 14.1 | 3.04 | 0.327 | 0.558 | 0.460 | 0.857 | 0.552 | ||||
| UKESM1-0-LL | [-] | 76.3 | 76.1 | 77.8 | 0.467 | 15.1 | 3.08 | 0.271 | 0.605 | 0.446 | 0.782 | 0.542 |
Temporally integrated period mean