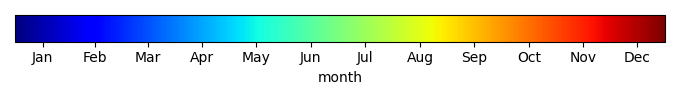
Mean State
Download Data |
Period Mean (original grids) [mm d-1] |
Model Period Mean (intersection) [mm d-1] |
Benchmark Period Mean (intersection) [mm d-1] |
Model Period Mean (complement) [mm d-1] |
Benchmark Period Mean (complement) [mm d-1] |
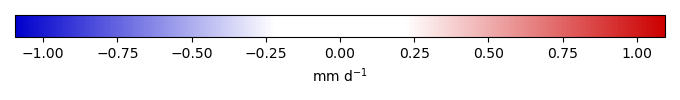
Bias [mm d-1] |
RMSE [mm d-1] |
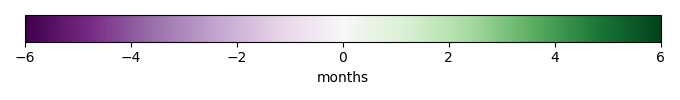
Phase Shift [months] |
Bias Score [1] |
RMSE Score [1] |
Seasonal Cycle Score [1] |
Spatial Distribution Score [1] |
Overall Score [1] |
|||
|---|---|---|---|---|---|---|---|---|---|---|---|---|---|---|---|---|
| Benchmark | [-] | 2.60 | ||||||||||||||
| ACCESS-ESM1-5 | [-] | 3.26 | 3.26 | 2.60 | 3.44 | 0.665 | 1.06 | 2.75 | 0.375 | 0.425 | 0.601 | 0.986 | 0.562 | |||
| BCC-CSM2-MR | [-] | 2.80 | 2.77 | 2.63 | 4.01 | 0.170 | 0.830 | 3.01 | 0.532 | 0.476 | 0.546 | 0.936 | 0.593 | |||
| BGCLND | [-] | 2.47 | 2.46 | 2.60 | 2.86 | 5.27 | -0.140 | 0.600 | 2.19 | 0.609 | 0.510 | 0.629 | 0.956 | 0.643 | ||
| BGCLNDATM_progCO2 | [-] | 2.71 | 2.69 | 2.60 | 3.34 | 5.27 | 0.0905 | 0.697 | 1.83 | 0.535 | 0.554 | 0.699 | 0.821 | 0.633 | ||
| CanESM5 | [-] | 3.06 | 3.06 | 2.60 | 3.56 | 0.477 | 0.932 | 2.22 | 0.456 | 0.432 | 0.699 | 0.985 | 0.601 | |||
| CNRM-ESM2-1 | [-] | 1.91 | 1.83 | 2.60 | 3.18 | -0.716 | 1.21 | 2.19 | 0.357 | 0.431 | 0.701 | 0.950 | 0.574 | |||
| EC-Earth3-CC | [-] | 3.28 | 2.61 | 2.60 | 4.00 | 0.0147 | 0.905 | 1.88 | 0.547 | 0.368 | 0.773 | 0.982 | 0.608 | |||
| MeanCMIP6 | [-] | 3.11 | 3.05 | 2.60 | 3.79 | 0.458 | 0.678 | 1.90 | 0.536 | 0.602 | 0.757 | 0.970 | 0.694 | |||
| MIROC-ES2L | [-] | 3.58 | 3.60 | 2.60 | 3.74 | 1.00 | 1.22 | 2.05 | 0.291 | 0.517 | 0.643 | 0.981 | 0.590 | |||
| MPI-ESM1-2-LR | [-] | 2.79 | 2.69 | 2.60 | 2.43 | 0.138 | 0.967 | 1.94 | 0.454 | 0.399 | 0.729 | 0.892 | 0.575 | |||
| MRI-ESM2-0 | [-] | 2.99 | 2.99 | 2.63 | 3.13 | 0.361 | 0.894 | 2.27 | 0.457 | 0.467 | 0.669 | 0.983 | 0.609 | |||
| NorESM2-LM | [-] | 2.30 | 2.22 | 2.60 | 3.09 | -0.327 | 0.818 | 2.47 | 0.441 | 0.494 | 0.581 | 0.943 | 0.591 | |||
| UKESM1-0-LL | [-] | 2.67 | 2.60 | 2.60 | 3.37 | 0.0343 | 0.721 | 2.04 | 0.633 | 0.477 | 0.735 | 0.984 | 0.661 |
Download Data |
Period Mean (original grids) [mm d-1] |
Model Period Mean (intersection) [mm d-1] |
Benchmark Period Mean (intersection) [mm d-1] |
Model Period Mean (complement) [mm d-1] |
Benchmark Period Mean (complement) [mm d-1] |
Bias [mm d-1] |
RMSE [mm d-1] |
Phase Shift [months] |
Bias Score [1] |
RMSE Score [1] |
Seasonal Cycle Score [1] |
Spatial Distribution Score [1] |
Overall Score [1] |
|||
|---|---|---|---|---|---|---|---|---|---|---|---|---|---|---|---|---|
| Benchmark | [-] | 4.13 | ||||||||||||||
| ACCESS-ESM1-5 | [-] | 4.30 | 4.27 | 4.13 | 4.40 | 0.259 | 0.739 | 2.82 | 0.496 | 0.428 | 0.522 | 0.939 | 0.563 | |||
| BCC-CSM2-MR | [-] | 4.23 | 4.20 | 4.12 | 4.38 | 0.189 | 0.738 | 2.80 | 0.475 | 0.449 | 0.537 | 0.944 | 0.571 | |||
| BGCLND | [-] | 3.82 | 3.79 | 4.11 | 3.90 | 4.85 | -0.315 | 0.658 | 2.22 | 0.424 | 0.542 | 0.637 | 0.935 | 0.616 | ||
| BGCLNDATM_progCO2 | [-] | 3.94 | 3.90 | 4.11 | 4.07 | 4.85 | -0.208 | 0.632 | 1.84 | 0.425 | 0.567 | 0.698 | 0.938 | 0.639 | ||
| CanESM5 | [-] | 4.15 | 4.09 | 4.13 | 4.22 | 0.0501 | 0.713 | 3.02 | 0.432 | 0.452 | 0.494 | 0.783 | 0.523 | |||
| CNRM-ESM2-1 | [-] | 3.40 | 3.35 | 4.13 | 3.63 | -0.612 | 0.938 | 2.96 | 0.301 | 0.446 | 0.504 | 0.993 | 0.538 | |||
| EC-Earth3-CC | [-] | 4.18 | 4.14 | 4.13 | 4.18 | 0.0166 | 0.774 | 2.55 | 0.446 | 0.412 | 0.573 | 0.982 | 0.565 | |||
| MeanCMIP6 | [-] | 4.20 | 4.16 | 4.12 | 4.34 | 0.0806 | 0.612 | 2.75 | 0.494 | 0.517 | 0.545 | 0.472 | 0.509 | |||
| MIROC-ES2L | [-] | 4.49 | 4.57 | 4.13 | 4.36 | 0.339 | 0.815 | 2.63 | 0.414 | 0.450 | 0.566 | 0.914 | 0.559 | |||
| MPI-ESM1-2-LR | [-] | 4.38 | 4.43 | 4.13 | 4.07 | 0.266 | 0.985 | 2.55 | 0.379 | 0.345 | 0.583 | 0.900 | 0.510 | |||
| MRI-ESM2-0 | [-] | 3.93 | 3.98 | 4.12 | 3.72 | -0.196 | 0.779 | 2.80 | 0.382 | 0.455 | 0.529 | 0.992 | 0.563 | |||
| NorESM2-LM | [-] | 3.74 | 3.65 | 4.13 | 4.00 | -0.309 | 0.742 | 2.47 | 0.388 | 0.505 | 0.597 | 0.929 | 0.585 | |||
| UKESM1-0-LL | [-] | 3.93 | 3.89 | 4.13 | 4.04 | -0.144 | 0.674 | 2.48 | 0.463 | 0.467 | 0.593 | 0.908 | 0.580 |
Download Data |
Period Mean (original grids) [mm d-1] |
Model Period Mean (intersection) [mm d-1] |
Benchmark Period Mean (intersection) [mm d-1] |
Model Period Mean (complement) [mm d-1] |
Benchmark Period Mean (complement) [mm d-1] |
Bias [mm d-1] |
RMSE [mm d-1] |
Phase Shift [months] |
Bias Score [1] |
RMSE Score [1] |
Seasonal Cycle Score [1] |
Spatial Distribution Score [1] |
Overall Score [1] |
|||
|---|---|---|---|---|---|---|---|---|---|---|---|---|---|---|---|---|
| Benchmark | [-] | 1.35 | ||||||||||||||
| ACCESS-ESM1-5 | [-] | 1.69 | 1.67 | 1.35 | 2.31 | 0.398 | 0.729 | 1.33 | 0.520 | 0.515 | 0.732 | 0.949 | 0.646 | |||
| BCC-CSM2-MR | [-] | 1.43 | 1.40 | 1.35 | 2.24 | 0.122 | 0.601 | 1.35 | 0.623 | 0.528 | 0.732 | 0.969 | 0.676 | |||
| BGCLND | [-] | 1.31 | 1.28 | 1.34 | 1.88 | 2.11 | -0.0625 | 0.405 | 1.06 | 0.667 | 0.626 | 0.779 | 0.977 | 0.735 | ||
| BGCLNDATM_progCO2 | [-] | 1.57 | 1.54 | 1.34 | 2.23 | 2.11 | 0.195 | 0.543 | 1.01 | 0.614 | 0.609 | 0.805 | 0.975 | 0.722 | ||
| CanESM5 | [-] | 1.52 | 1.47 | 1.35 | 2.31 | 0.233 | 0.756 | 1.34 | 0.538 | 0.468 | 0.747 | 0.949 | 0.634 | |||
| CNRM-ESM2-1 | [-] | 1.30 | 1.26 | 1.35 | 2.30 | -6.63e-05 | 0.632 | 1.35 | 0.566 | 0.524 | 0.738 | 0.952 | 0.661 | |||
| EC-Earth3-CC | [-] | 1.64 | 1.47 | 1.35 | 3.04 | 0.127 | 0.617 | 1.08 | 0.591 | 0.514 | 0.790 | 0.961 | 0.674 | |||
| MeanCMIP6 | [-] | 1.54 | 1.50 | 1.35 | 2.49 | 0.219 | 0.586 | 1.13 | 0.608 | 0.599 | 0.783 | 0.967 | 0.711 | |||
| MIROC-ES2L | [-] | 1.94 | 1.89 | 1.35 | 2.45 | 0.604 | 0.889 | 1.31 | 0.433 | 0.540 | 0.743 | 0.916 | 0.635 | |||
| MPI-ESM1-2-LR | [-] | 1.44 | 1.43 | 1.35 | 1.64 | 0.193 | 0.689 | 1.21 | 0.531 | 0.502 | 0.774 | 0.942 | 0.650 | |||
| MRI-ESM2-0 | [-] | 1.59 | 1.57 | 1.35 | 2.17 | 0.275 | 0.650 | 1.30 | 0.562 | 0.541 | 0.735 | 0.960 | 0.668 | |||
| NorESM2-LM | [-] | 1.35 | 1.30 | 1.35 | 2.28 | 0.0329 | 0.602 | 1.24 | 0.583 | 0.561 | 0.745 | 0.966 | 0.683 | |||
| UKESM1-0-LL | [-] | 1.43 | 1.40 | 1.35 | 2.26 | 0.140 | 0.567 | 1.06 | 0.621 | 0.569 | 0.794 | 0.965 | 0.703 |
Download Data |
Period Mean (original grids) [mm d-1] |
Model Period Mean (intersection) [mm d-1] |
Benchmark Period Mean (intersection) [mm d-1] |
Model Period Mean (complement) [mm d-1] |
Benchmark Period Mean (complement) [mm d-1] |
Bias [mm d-1] |
RMSE [mm d-1] |
Phase Shift [months] |
Bias Score [1] |
RMSE Score [1] |
Seasonal Cycle Score [1] |
Spatial Distribution Score [1] |
Overall Score [1] |
|||
|---|---|---|---|---|---|---|---|---|---|---|---|---|---|---|---|---|
| Benchmark | [-] | 0.858 | ||||||||||||||
| ACCESS-ESM1-5 | [-] | 1.18 | 1.21 | 0.858 | 0.950 | 0.320 | 0.526 | 0.805 | 0.704 | 0.723 | 0.913 | 0.903 | 0.794 | |||
| BCC-CSM2-MR | [-] | 0.760 | 0.777 | 0.858 | 0.638 | -0.0920 | 0.468 | 0.665 | 0.835 | 0.670 | 0.925 | 0.981 | 0.816 | |||
| BGCLND | [-] | 0.715 | 0.718 | 0.858 | 0.671 | 0.804 | -0.141 | 0.344 | 0.373 | 0.838 | 0.753 | 0.974 | 0.972 | 0.858 | ||
| BGCLNDATM_progCO2 | [-] | 0.883 | 0.880 | 0.858 | 0.935 | 0.804 | 0.0211 | 0.354 | 0.517 | 0.870 | 0.738 | 0.961 | 0.989 | 0.859 | ||
| CanESM5 | [-] | 0.828 | 0.844 | 0.858 | 0.713 | -0.0271 | 0.508 | 0.758 | 0.827 | 0.643 | 0.912 | 0.972 | 0.800 | |||
| CNRM-ESM2-1 | [-] | 0.886 | 0.890 | 0.858 | 0.912 | 0.0309 | 0.414 | 0.628 | 0.831 | 0.715 | 0.940 | 0.976 | 0.836 | |||
| EC-Earth3-CC | [-] | 1.02 | 0.806 | 0.858 | 1.27 | -0.0507 | 0.442 | 0.624 | 0.815 | 0.702 | 0.927 | 0.964 | 0.822 | |||
| MeanCMIP6 | [-] | 0.737 | 0.733 | 0.860 | 0.779 | -0.128 | 0.465 | 0.618 | 0.829 | 0.663 | 0.931 | 0.976 | 0.813 | |||
| MIROC-ES2L | [-] | 1.13 | 1.16 | 0.858 | 0.994 | 0.278 | 0.558 | 0.746 | 0.736 | 0.683 | 0.918 | 0.867 | 0.777 | |||
| MPI-ESM1-2-LR | [-] | 0.970 | 0.991 | 0.858 | 0.773 | 0.117 | 0.408 | 0.694 | 0.802 | 0.753 | 0.926 | 0.930 | 0.833 | |||
| MRI-ESM2-0 | [-] | 0.958 | 0.975 | 0.858 | 0.863 | 0.108 | 0.473 | 0.649 | 0.815 | 0.695 | 0.929 | 0.952 | 0.817 | |||
| NorESM2-LM | [-] | 0.709 | 0.698 | 0.858 | 0.664 | -0.167 | 0.521 | 0.714 | 0.802 | 0.650 | 0.921 | 0.974 | 0.800 | |||
| UKESM1-0-LL | [-] | 0.812 | 0.814 | 0.858 | 0.771 | -0.0484 | 0.407 | 0.620 | 0.860 | 0.703 | 0.930 | 0.984 | 0.836 |
Download Data |
Period Mean (original grids) [mm d-1] |
Model Period Mean (intersection) [mm d-1] |
Benchmark Period Mean (intersection) [mm d-1] |
Model Period Mean (complement) [mm d-1] |
Benchmark Period Mean (complement) [mm d-1] |
Bias [mm d-1] |
RMSE [mm d-1] |
Phase Shift [months] |
Bias Score [1] |
RMSE Score [1] |
Seasonal Cycle Score [1] |
Spatial Distribution Score [1] |
Overall Score [1] |
|||
|---|---|---|---|---|---|---|---|---|---|---|---|---|---|---|---|---|
| Benchmark | [-] | 3.69 | ||||||||||||||
| ACCESS-ESM1-5 | [-] | 3.75 | 3.76 | 3.69 | 3.41 | 0.0751 | 0.956 | 2.49 | 0.451 | 0.323 | 0.593 | 0.940 | 0.526 | |||
| BCC-CSM2-MR | [-] | 3.51 | 3.51 | 3.69 | 3.64 | -0.168 | 0.766 | 2.54 | 0.500 | 0.380 | 0.607 | 0.983 | 0.570 | |||
| BGCLND | [-] | 3.45 | 3.45 | 3.68 | 3.27 | 4.90 | -0.234 | 0.581 | 2.91 | 0.522 | 0.470 | 0.479 | 0.956 | 0.579 | ||
| BGCLNDATM_progCO2 | [-] | 3.61 | 3.61 | 3.68 | 3.62 | 4.90 | -0.0738 | 0.606 | 2.54 | 0.533 | 0.476 | 0.568 | 0.886 | 0.588 | ||
| CanESM5 | [-] | 3.01 | 3.01 | 3.69 | 3.45 | -0.651 | 1.49 | 2.36 | 0.298 | 0.189 | 0.628 | 0.870 | 0.435 | |||
| CNRM-ESM2-1 | [-] | 3.14 | 3.15 | 3.69 | 3.16 | -0.524 | 0.940 | 2.90 | 0.398 | 0.323 | 0.509 | 0.936 | 0.498 | |||
| EC-Earth3-CC | [-] | 3.45 | 3.43 | 3.69 | 3.81 | -0.262 | 1.07 | 2.09 | 0.430 | 0.301 | 0.659 | 0.866 | 0.512 | |||
| MeanCMIP6 | [-] | 3.71 | 3.71 | 3.68 | 3.77 | 0.0271 | 0.657 | 2.21 | 0.516 | 0.474 | 0.657 | 0.974 | 0.619 | |||
| MIROC-ES2L | [-] | 4.57 | 4.58 | 3.69 | 4.06 | 0.870 | 1.13 | 2.43 | 0.248 | 0.454 | 0.608 | 0.988 | 0.551 | |||
| MPI-ESM1-2-LR | [-] | 3.60 | 3.61 | 3.69 | 2.28 | -0.0752 | 1.19 | 2.13 | 0.354 | 0.304 | 0.660 | 0.721 | 0.469 | |||
| MRI-ESM2-0 | [-] | 4.23 | 4.24 | 3.69 | 3.10 | 0.522 | 0.983 | 3.05 | 0.300 | 0.382 | 0.465 | 0.896 | 0.485 | |||
| NorESM2-LM | [-] | 3.32 | 3.30 | 3.69 | 3.57 | -0.354 | 0.717 | 2.47 | 0.383 | 0.518 | 0.589 | 0.696 | 0.541 | |||
| UKESM1-0-LL | [-] | 3.78 | 3.78 | 3.69 | 3.68 | 0.0997 | 0.747 | 1.96 | 0.502 | 0.420 | 0.681 | 0.992 | 0.603 |
Download Data |
Period Mean (original grids) [mm d-1] |
Model Period Mean (intersection) [mm d-1] |
Benchmark Period Mean (intersection) [mm d-1] |
Model Period Mean (complement) [mm d-1] |
Benchmark Period Mean (complement) [mm d-1] |
Bias [mm d-1] |
RMSE [mm d-1] |
Phase Shift [months] |
Bias Score [1] |
RMSE Score [1] |
Seasonal Cycle Score [1] |
Spatial Distribution Score [1] |
Overall Score [1] |
|||
|---|---|---|---|---|---|---|---|---|---|---|---|---|---|---|---|---|
| Benchmark | [-] | 1.06 | ||||||||||||||
| ACCESS-ESM1-5 | [-] | 1.51 | 1.49 | 1.06 | 1.93 | 0.451 | 0.692 | 0.821 | 0.643 | 0.685 | 0.890 | 0.957 | 0.772 | |||
| BCC-CSM2-MR | [-] | 1.09 | 1.07 | 1.06 | 1.64 | 0.0357 | 0.548 | 0.804 | 0.793 | 0.659 | 0.892 | 0.974 | 0.796 | |||
| BGCLND | [-] | 0.976 | 0.943 | 1.06 | 1.49 | 1.69 | -0.113 | 0.401 | 0.433 | 0.806 | 0.727 | 0.964 | 0.954 | 0.836 | ||
| BGCLNDATM_progCO2 | [-] | 1.23 | 1.20 | 1.06 | 1.83 | 1.69 | 0.139 | 0.481 | 0.577 | 0.794 | 0.708 | 0.944 | 0.976 | 0.826 | ||
| CanESM5 | [-] | 1.13 | 1.12 | 1.06 | 1.48 | 0.104 | 0.648 | 0.941 | 0.762 | 0.604 | 0.873 | 0.937 | 0.756 | |||
| CNRM-ESM2-1 | [-] | 1.14 | 1.11 | 1.06 | 1.87 | 0.0939 | 0.525 | 0.756 | 0.778 | 0.675 | 0.918 | 0.961 | 0.802 | |||
| EC-Earth3-CC | [-] | 1.81 | 1.11 | 1.06 | 2.68 | 0.0532 | 0.542 | 0.704 | 0.760 | 0.676 | 0.904 | 0.874 | 0.778 | |||
| MeanCMIP6 | [-] | 1.04 | 1.00 | 1.06 | 1.76 | -0.0195 | 0.534 | 0.766 | 0.799 | 0.654 | 0.897 | 0.977 | 0.796 | |||
| MIROC-ES2L | [-] | 1.54 | 1.52 | 1.06 | 1.90 | 0.485 | 0.787 | 0.877 | 0.639 | 0.629 | 0.879 | 0.881 | 0.731 | |||
| MPI-ESM1-2-LR | [-] | 1.24 | 1.24 | 1.06 | 1.23 | 0.227 | 0.607 | 0.830 | 0.723 | 0.674 | 0.896 | 0.920 | 0.777 | |||
| MRI-ESM2-0 | [-] | 1.31 | 1.31 | 1.06 | 1.43 | 0.272 | 0.644 | 0.718 | 0.729 | 0.656 | 0.908 | 0.949 | 0.779 | |||
| NorESM2-LM | [-] | 1.00 | 0.958 | 1.06 | 1.49 | -0.0564 | 0.605 | 0.799 | 0.765 | 0.626 | 0.900 | 0.957 | 0.775 | |||
| UKESM1-0-LL | [-] | 1.08 | 1.07 | 1.06 | 1.52 | 0.0513 | 0.513 | 0.733 | 0.807 | 0.677 | 0.903 | 0.966 | 0.806 |
Temporally integrated period mean