Mean State
Download Data |
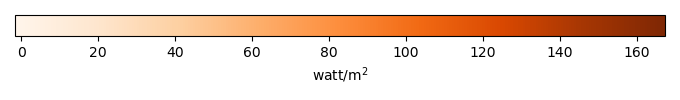
Period Mean (original grids) [watt/m2] |
Model Period Mean (intersection) [watt/m2] |
Benchmark Period Mean (intersection) [watt/m2] |
Model Period Mean (complement) [watt/m2] |
Benchmark Period Mean (complement) [watt/m2] |
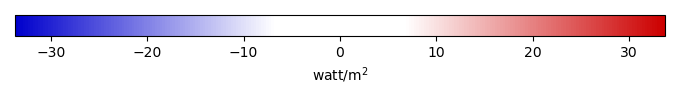
Bias [watt/m2] |
RMSE [watt/m2] |
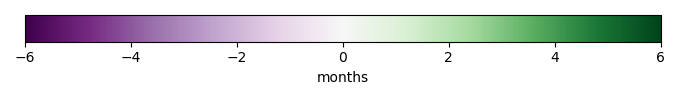
Phase Shift [months] |
Bias Score [1] |
RMSE Score [1] |
Seasonal Cycle Score [1] |
Spatial Distribution Score [1] |
Overall Score [1] |
|||
|---|---|---|---|---|---|---|---|---|---|---|---|---|---|---|---|---|
| Benchmark | [-] | 76.3 | ||||||||||||||
| BCC-CSM2-MR | [-] | 80.5 | 79.4 | 76.9 | 121. | 3.06 | 19.6 | 2.31 | 0.607 | 0.561 | 0.662 | 0.947 | 0.667 | |||
| BGCv2LND.GSW | [-] | 71.4 | 71.0 | 76.3 | 81.0 | -5.35 | 16.1 | 1.63 | 0.655 | 0.579 | 0.744 | 0.939 | 0.699 | |||
| BGCv2LNDATM | [-] | 78.2 | 77.6 | 76.3 | 95.2 | 1.24 | 16.1 | 1.40 | 0.669 | 0.567 | 0.802 | 0.994 | 0.720 | |||
| CanESM5 | [-] | 88.3 | 88.1 | 76.3 | 104. | 12.2 | 29.0 | 2.61 | 0.434 | 0.421 | 0.596 | 0.806 | 0.536 | |||
| MeanCMIP6 | [-] | 74.8 | 73.2 | 76.3 | 94.0 | -2.99 | 16.7 | 2.16 | 0.685 | 0.562 | 0.662 | 0.985 | 0.691 | |||
| MIROC-ES2L | [-] | 103. | 104. | 76.3 | 107. | 27.4 | 35.1 | 2.32 | 0.307 | 0.492 | 0.595 | 0.850 | 0.547 | |||
| UKESM1-0-LL | [-] | 77.5 | 75.4 | 76.3 | 104. | -0.275 | 21.9 | 2.71 | 0.510 | 0.536 | 0.555 | 0.793 | 0.586 |
Download Data |
Period Mean (original grids) [watt/m2] |
Model Period Mean (intersection) [watt/m2] |
Benchmark Period Mean (intersection) [watt/m2] |
Model Period Mean (complement) [watt/m2] |
Benchmark Period Mean (complement) [watt/m2] |
Bias [watt/m2] |
RMSE [watt/m2] |
Phase Shift [months] |
Bias Score [1] |
RMSE Score [1] |
Seasonal Cycle Score [1] |
Spatial Distribution Score [1] |
Overall Score [1] |
|||
|---|---|---|---|---|---|---|---|---|---|---|---|---|---|---|---|---|
| Benchmark | [-] | 109. | ||||||||||||||
| BCC-CSM2-MR | [-] | 123. | 121. | 109. | 127. | 14.2 | 19.7 | 2.74 | 0.353 | 0.379 | 0.552 | 0.964 | 0.525 | |||
| BGCv2LND.GSW | [-] | 110. | 110. | 109. | 111. | 0.975 | 11.1 | 1.51 | 0.549 | 0.591 | 0.776 | 0.995 | 0.700 | |||
| BGCv2LNDATM | [-] | 114. | 113. | 109. | 115. | 4.14 | 13.0 | 1.66 | 0.464 | 0.481 | 0.763 | 0.994 | 0.636 | |||
| CanESM5 | [-] | 120. | 119. | 109. | 122. | 12.0 | 17.5 | 2.44 | 0.371 | 0.388 | 0.615 | 0.993 | 0.551 | |||
| MeanCMIP6 | [-] | 101. | 99.9 | 109. | 104. | -8.51 | 15.4 | 2.36 | 0.322 | 0.481 | 0.629 | 0.592 | 0.501 | |||
| MIROC-ES2L | [-] | 130. | 132. | 109. | 127. | 20.4 | 26.2 | 2.51 | 0.202 | 0.378 | 0.606 | 0.974 | 0.507 | |||
| UKESM1-0-LL | [-] | 113. | 112. | 109. | 116. | 4.46 | 13.5 | 2.23 | 0.554 | 0.455 | 0.648 | 0.996 | 0.622 |
Download Data |
Period Mean (original grids) [watt/m2] |
Model Period Mean (intersection) [watt/m2] |
Benchmark Period Mean (intersection) [watt/m2] |
Model Period Mean (complement) [watt/m2] |
Benchmark Period Mean (complement) [watt/m2] |
Bias [watt/m2] |
RMSE [watt/m2] |
Phase Shift [months] |
Bias Score [1] |
RMSE Score [1] |
Seasonal Cycle Score [1] |
Spatial Distribution Score [1] |
Overall Score [1] |
|||
|---|---|---|---|---|---|---|---|---|---|---|---|---|---|---|---|---|
| Benchmark | [-] | 48.9 | ||||||||||||||
| BCC-CSM2-MR | [-] | 41.4 | 49.3 | 48.9 | 15.4 | 2.07 | 18.3 | 1.24 | 0.634 | 0.528 | 0.793 | 0.954 | 0.687 | |||
| BGCv2LND.GSW | [-] | 37.9 | 45.5 | 48.9 | 14.6 | 33.8 | -3.43 | 12.6 | 0.862 | 0.713 | 0.638 | 0.874 | 0.989 | 0.770 | ||
| BGCv2LNDATM | [-] | 45.4 | 53.7 | 48.9 | 20.1 | 33.8 | 4.79 | 15.0 | 0.876 | 0.681 | 0.601 | 0.859 | 0.985 | 0.745 | ||
| CanESM5 | [-] | 43.9 | 51.8 | 48.9 | 17.8 | 5.72 | 23.8 | 1.44 | 0.527 | 0.465 | 0.757 | 0.919 | 0.627 | |||
| MeanCMIP6 | [-] | 37.4 | 44.1 | 48.9 | 16.5 | -3.52 | 17.7 | 1.11 | 0.625 | 0.556 | 0.809 | 0.980 | 0.705 | |||
| MIROC-ES2L | [-] | 55.6 | 65.5 | 48.9 | 25.3 | 18.1 | 27.4 | 1.29 | 0.403 | 0.531 | 0.766 | 0.864 | 0.619 | |||
| UKESM1-0-LL | [-] | 41.5 | 49.7 | 48.9 | 14.3 | 2.78 | 18.3 | 1.18 | 0.588 | 0.566 | 0.792 | 0.932 | 0.689 |
Download Data |
Period Mean (original grids) [watt/m2] |
Model Period Mean (intersection) [watt/m2] |
Benchmark Period Mean (intersection) [watt/m2] |
Model Period Mean (complement) [watt/m2] |
Benchmark Period Mean (complement) [watt/m2] |
Bias [watt/m2] |
RMSE [watt/m2] |
Phase Shift [months] |
Bias Score [1] |
RMSE Score [1] |
Seasonal Cycle Score [1] |
Spatial Distribution Score [1] |
Overall Score [1] |
|||
|---|---|---|---|---|---|---|---|---|---|---|---|---|---|---|---|---|
| Benchmark | [-] | 25.2 | ||||||||||||||
| BCC-CSM2-MR | [-] | 22.1 | 24.3 | 25.2 | 9.53 | -0.956 | 12.8 | 0.667 | 0.876 | 0.683 | 0.935 | 0.917 | 0.819 | |||
| BGCv2LND.GSW | [-] | 20.8 | 22.8 | 25.2 | 9.12 | 26.3 | -2.40 | 9.50 | 0.439 | 0.880 | 0.763 | 0.970 | 0.990 | 0.873 | ||
| BGCv2LNDATM | [-] | 25.6 | 27.5 | 25.2 | 14.4 | 26.3 | 2.32 | 10.0 | 0.456 | 0.870 | 0.755 | 0.968 | 0.936 | 0.857 | ||
| CanESM5 | [-] | 24.1 | 26.4 | 25.2 | 12.0 | 0.994 | 14.3 | 0.814 | 0.861 | 0.650 | 0.914 | 0.887 | 0.792 | |||
| MeanCMIP6 | [-] | 18.2 | 19.5 | 25.2 | 10.7 | -5.65 | 15.7 | 0.618 | 0.809 | 0.621 | 0.942 | 0.989 | 0.796 | |||
| MIROC-ES2L | [-] | 32.4 | 35.3 | 25.2 | 19.9 | 9.83 | 16.8 | 0.715 | 0.701 | 0.694 | 0.927 | 0.669 | 0.737 | |||
| UKESM1-0-LL | [-] | 23.7 | 25.5 | 25.2 | 10.7 | 0.314 | 11.6 | 0.622 | 0.896 | 0.705 | 0.941 | 0.959 | 0.841 |
Download Data |
Period Mean (original grids) [watt/m2] |
Model Period Mean (intersection) [watt/m2] |
Benchmark Period Mean (intersection) [watt/m2] |
Model Period Mean (complement) [watt/m2] |
Benchmark Period Mean (complement) [watt/m2] |
Bias [watt/m2] |
RMSE [watt/m2] |
Phase Shift [months] |
Bias Score [1] |
RMSE Score [1] |
Seasonal Cycle Score [1] |
Spatial Distribution Score [1] |
Overall Score [1] |
|||
|---|---|---|---|---|---|---|---|---|---|---|---|---|---|---|---|---|
| Benchmark | [-] | 99.9 | ||||||||||||||
| BCC-CSM2-MR | [-] | 101. | 101. | 99.9 | 107. | 1.49 | 24.1 | 2.15 | 0.454 | 0.218 | 0.687 | 0.990 | 0.514 | |||
| BGCv2LND.GSW | [-] | 99.6 | 99.8 | 99.9 | 91.5 | -0.0352 | 12.0 | 0.979 | 0.584 | 0.492 | 0.878 | 0.983 | 0.686 | |||
| BGCv2LNDATM | [-] | 104. | 104. | 99.9 | 102. | 4.45 | 15.0 | 1.87 | 0.591 | 0.432 | 0.702 | 0.925 | 0.616 | |||
| CanESM5 | [-] | 87.6 | 87.5 | 99.9 | 94.1 | -12.0 | 42.1 | 2.39 | 0.232 | 0.121 | 0.625 | 0.815 | 0.383 | |||
| MeanCMIP6 | [-] | 89.3 | 89.3 | 99.9 | 90.6 | -10.7 | 19.8 | 2.11 | 0.358 | 0.379 | 0.681 | 0.951 | 0.550 | |||
| MIROC-ES2L | [-] | 132. | 133. | 99.9 | 116. | 32.1 | 38.4 | 2.38 | 0.118 | 0.361 | 0.629 | 0.959 | 0.485 | |||
| UKESM1-0-LL | [-] | 109. | 109. | 99.9 | 106. | 8.88 | 23.5 | 2.24 | 0.310 | 0.326 | 0.640 | 0.983 | 0.517 |
Download Data |
Period Mean (original grids) [watt/m2] |
Model Period Mean (intersection) [watt/m2] |
Benchmark Period Mean (intersection) [watt/m2] |
Model Period Mean (complement) [watt/m2] |
Benchmark Period Mean (complement) [watt/m2] |
Bias [watt/m2] |
RMSE [watt/m2] |
Phase Shift [months] |
Bias Score [1] |
RMSE Score [1] |
Seasonal Cycle Score [1] |
Spatial Distribution Score [1] |
Overall Score [1] |
|||
|---|---|---|---|---|---|---|---|---|---|---|---|---|---|---|---|---|
| Benchmark | [-] | 31.9 | ||||||||||||||
| BCC-CSM2-MR | [-] | 31.6 | 31.6 | 31.9 | 33.4 | 0.351 | 13.8 | 0.715 | 0.837 | 0.665 | 0.916 | 0.935 | 0.803 | |||
| BGCv2LND.GSW | [-] | 28.3 | 28.2 | 31.9 | 29.2 | 35.3 | -3.62 | 10.6 | 0.525 | 0.835 | 0.733 | 0.959 | 0.990 | 0.850 | ||
| BGCv2LNDATM | [-] | 35.7 | 35.2 | 31.9 | 40.7 | 35.3 | 3.31 | 12.1 | 0.553 | 0.827 | 0.706 | 0.954 | 0.969 | 0.832 | ||
| CanESM5 | [-] | 32.7 | 33.1 | 31.9 | 30.3 | 2.42 | 16.8 | 0.966 | 0.785 | 0.618 | 0.876 | 0.840 | 0.747 | |||
| MeanCMIP6 | [-] | 25.8 | 25.3 | 31.9 | 30.5 | -5.91 | 16.4 | 0.697 | 0.770 | 0.613 | 0.915 | 0.985 | 0.779 | |||
| MIROC-ES2L | [-] | 44.4 | 44.2 | 31.9 | 46.7 | 13.1 | 20.6 | 0.779 | 0.625 | 0.651 | 0.902 | 0.725 | 0.711 | |||
| UKESM1-0-LL | [-] | 31.2 | 31.6 | 31.9 | 28.8 | 0.681 | 13.4 | 0.709 | 0.823 | 0.681 | 0.921 | 0.918 | 0.805 |
Temporally integrated period mean