Mean State
Download Data |
Period Mean (original grids) [Pg] |
Model Period Mean (intersection) [Pg] |
Benchmark Period Mean (intersection) [Pg] |
Model Period Mean (complement) [Pg] |
Benchmark Period Mean (complement) [Pg] |
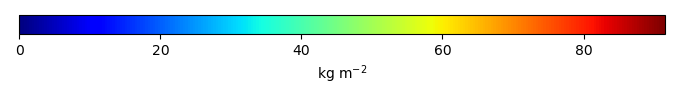
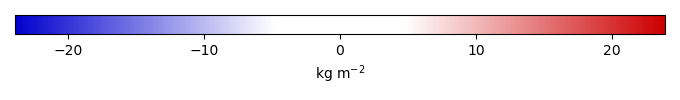
Bias [kg m-2] |
Bias Score [1] |
Spatial Distribution Score [1] |
Overall Score [1] |
|||
|---|---|---|---|---|---|---|---|---|---|---|---|---|
| Benchmark | [-] | 233. | ||||||||||
| CLM-CRUJRA | [-] | 319. | 317. | 231. | 0.236 | 2.90 | 6.08 | 0.607 | 0.614 | 0.610 | ||
| CLM-GSWP3 | [-] | 217. | 216. | 231. | 0.142 | 2.90 | -0.978 | 0.620 | 0.854 | 0.737 | ||
| CLM-Princeton | [-] | 430. | 427. | 231. | 0.273 | 2.90 | 13.8 | 0.577 | 0.181 | 0.379 | ||
| ISBA-CTRIP-CRUJRA | [-] | 285. | 287. | 233. | 0.345 | 0.619 | 3.83 | 0.665 | 0.790 | 0.728 | ||
| ISBA-CTRIP-GSWP3 | [-] | 268. | 270. | 233. | 0.318 | 0.619 | 2.63 | 0.679 | 0.752 | 0.715 | ||
| ISBA-CTRIP-Princeton | [-] | 359. | 361. | 233. | 0.400 | 0.619 | 8.98 | 0.594 | 0.881 | 0.737 | ||
| JSBACH-CRUJRA | [-] | 123. | 123. | 220. | 0.130 | 13.4 | -7.17 | 0.616 | 0.295 | 0.456 | ||
| JSBACH-GSWP3 | [-] | 130. | 130. | 220. | 0.142 | 13.4 | -6.61 | 0.631 | 0.260 | 0.445 | ||
| JSBACH-Princeton | [-] | 131. | 131. | 220. | 0.133 | 13.4 | -6.54 | 0.635 | 0.250 | 0.443 | ||
| Mean-CRUJRA | [-] | 319. | 317. | 231. | 0.236 | 2.90 | 6.08 | 0.607 | 0.614 | 0.610 | ||
| Mean-GSWP3 | [-] | 217. | 216. | 231. | 0.142 | 2.90 | -0.978 | 0.620 | 0.854 | 0.737 | ||
| Mean-Princeton | [-] | 430. | 427. | 231. | 0.273 | 2.90 | 13.8 | 0.577 | 0.181 | 0.379 |
Download Data |
Period Mean (original grids) [Pg] |
Model Period Mean (intersection) [Pg] |
Benchmark Period Mean (intersection) [Pg] |
Model Period Mean (complement) [Pg] |
Benchmark Period Mean (complement) [Pg] |
Bias [kg m-2] |
Bias Score [1] |
Spatial Distribution Score [1] |
Overall Score [1] |
|||
|---|---|---|---|---|---|---|---|---|---|---|---|---|
| Benchmark | [-] | 1.33e+03 | ||||||||||
| CLM-CRUJRA | [-] | 1.67e+03 | 1.66e+03 | 1.31e+03 | 64.3 | 24.3 | 2.51 | 0.583 | 0.194 | 0.389 | ||
| CLM-GSWP3 | [-] | 1.15e+03 | 1.12e+03 | 1.31e+03 | 46.3 | 24.3 | -1.32 | 0.595 | 0.433 | 0.514 | ||
| CLM-Princeton | [-] | 2.06e+03 | 2.09e+03 | 1.31e+03 | 68.6 | 24.3 | 5.57 | 0.571 | 0.0897 | 0.330 | ||
| ISBA-CTRIP-CRUJRA | [-] | 2.00e+03 | 1.88e+03 | 1.33e+03 | 109. | 4.45 | 3.87 | 0.584 | 0.848 | 0.716 | ||
| ISBA-CTRIP-GSWP3 | [-] | 1.79e+03 | 1.68e+03 | 1.33e+03 | 100. | 4.45 | 2.49 | 0.618 | 0.881 | 0.749 | ||
| ISBA-CTRIP-Princeton | [-] | 2.18e+03 | 2.05e+03 | 1.33e+03 | 115. | 4.45 | 5.13 | 0.545 | 0.746 | 0.646 | ||
| JSBACH-CRUJRA | [-] | 555. | 599. | 1.19e+03 | 11.4 | 147. | -4.57 | 0.593 | 0.697 | 0.645 | ||
| JSBACH-GSWP3 | [-] | 657. | 681. | 1.19e+03 | 11.5 | 147. | -3.93 | 0.623 | 0.709 | 0.666 | ||
| JSBACH-Princeton | [-] | 601. | 633. | 1.19e+03 | 10.3 | 147. | -4.30 | 0.610 | 0.683 | 0.647 | ||
| Mean-CRUJRA | [-] | 1.73e+03 | 1.66e+03 | 1.31e+03 | 64.3 | 24.3 | 2.51 | 0.583 | 0.194 | 0.389 | ||
| Mean-GSWP3 | [-] | 1.18e+03 | 1.12e+03 | 1.31e+03 | 46.3 | 24.3 | -1.32 | 0.595 | 0.433 | 0.514 | ||
| Mean-Princeton | [-] | 2.17e+03 | 2.09e+03 | 1.31e+03 | 68.6 | 24.3 | 5.57 | 0.571 | 0.0897 | 0.330 |
Download Data |
Period Mean (original grids) [Pg] |
Model Period Mean (intersection) [Pg] |
Benchmark Period Mean (intersection) [Pg] |
Model Period Mean (complement) [Pg] |
Benchmark Period Mean (complement) [Pg] |
Bias [kg m-2] |
Bias Score [1] |
Spatial Distribution Score [1] |
Overall Score [1] |
|||
|---|---|---|---|---|---|---|---|---|---|---|---|---|
| Benchmark | [-] | 142. | ||||||||||
| CLM-CRUJRA | [-] | 47.0 | 45.6 | 138. | 0.235 | 3.68 | -3.10 | 0.503 | 0.701 | 0.602 | ||
| CLM-GSWP3 | [-] | 40.9 | 40.1 | 138. | 0.250 | 3.68 | -3.29 | 0.489 | 0.598 | 0.543 | ||
| CLM-Princeton | [-] | 47.0 | 45.5 | 138. | 0.235 | 3.68 | -3.11 | 0.500 | 0.717 | 0.608 | ||
| ISBA-CTRIP-CRUJRA | [-] | 117. | 116. | 141. | 1.08 | 0.772 | -0.831 | 0.555 | 0.723 | 0.639 | ||
| ISBA-CTRIP-GSWP3 | [-] | 93.5 | 93.3 | 141. | 1.16 | 0.772 | -1.57 | 0.555 | 0.789 | 0.672 | ||
| ISBA-CTRIP-Princeton | [-] | 108. | 108. | 141. | 1.23 | 0.772 | -1.09 | 0.538 | 0.693 | 0.616 | ||
| JSBACH-CRUJRA | [-] | 22.8 | 22.8 | 130. | 0.174 | 12.4 | -3.78 | 0.445 | 0.252 | 0.348 | ||
| JSBACH-GSWP3 | [-] | 38.7 | 38.3 | 130. | 0.733 | 12.4 | -3.23 | 0.498 | 0.281 | 0.390 | ||
| JSBACH-Princeton | [-] | 23.0 | 23.0 | 130. | 0.155 | 12.4 | -3.77 | 0.446 | 0.271 | 0.358 | ||
| Mean-CRUJRA | [-] | 47.0 | 45.6 | 138. | 0.235 | 3.68 | -3.10 | 0.503 | 0.701 | 0.602 | ||
| Mean-GSWP3 | [-] | 40.9 | 40.1 | 138. | 0.250 | 3.68 | -3.29 | 0.489 | 0.598 | 0.543 | ||
| Mean-Princeton | [-] | 47.0 | 45.5 | 138. | 0.235 | 3.68 | -3.11 | 0.500 | 0.717 | 0.608 |
Download Data |
Period Mean (original grids) [Pg] |
Model Period Mean (intersection) [Pg] |
Benchmark Period Mean (intersection) [Pg] |
Model Period Mean (complement) [Pg] |
Benchmark Period Mean (complement) [Pg] |
Bias [kg m-2] |
Bias Score [1] |
Spatial Distribution Score [1] |
Overall Score [1] |
|||
|---|---|---|---|---|---|---|---|---|---|---|---|---|
| Benchmark | [-] | 43.2 | ||||||||||
| CLM-CRUJRA | [-] | 25.8 | 25.2 | 42.9 | 0.0361 | 0.283 | -2.07 | 0.538 | 0.408 | 0.473 | ||
| CLM-GSWP3 | [-] | 20.0 | 19.5 | 42.9 | 0.0506 | 0.283 | -2.73 | 0.541 | 0.801 | 0.671 | ||
| CLM-Princeton | [-] | 37.0 | 36.0 | 42.9 | 0.0416 | 0.283 | -0.824 | 0.529 | 0.187 | 0.358 | ||
| ISBA-CTRIP-CRUJRA | [-] | 54.0 | 50.7 | 43.1 | 0.131 | 0.0704 | 0.830 | 0.580 | 0.462 | 0.521 | ||
| ISBA-CTRIP-GSWP3 | [-] | 51.3 | 48.3 | 43.1 | 0.137 | 0.0704 | 0.555 | 0.605 | 0.555 | 0.580 | ||
| ISBA-CTRIP-Princeton | [-] | 56.4 | 53.0 | 43.1 | 0.150 | 0.0704 | 1.10 | 0.552 | 0.400 | 0.476 | ||
| JSBACH-CRUJRA | [-] | 10.5 | 10.3 | 41.6 | 0.00832 | 1.62 | -3.81 | 0.478 | 0.571 | 0.524 | ||
| JSBACH-GSWP3 | [-] | 20.2 | 20.4 | 41.6 | 0.0181 | 1.62 | -2.58 | 0.564 | 0.862 | 0.713 | ||
| JSBACH-Princeton | [-] | 13.7 | 13.2 | 41.6 | 0.0139 | 1.62 | -3.45 | 0.510 | 0.719 | 0.615 | ||
| Mean-CRUJRA | [-] | 25.8 | 25.2 | 42.9 | 0.0361 | 0.283 | -2.07 | 0.538 | 0.408 | 0.473 | ||
| Mean-GSWP3 | [-] | 20.0 | 19.5 | 42.9 | 0.0506 | 0.283 | -2.73 | 0.541 | 0.801 | 0.671 | ||
| Mean-Princeton | [-] | 37.0 | 36.0 | 42.9 | 0.0416 | 0.283 | -0.824 | 0.529 | 0.187 | 0.358 |
Download Data |
Period Mean (original grids) [Pg] |
Model Period Mean (intersection) [Pg] |
Benchmark Period Mean (intersection) [Pg] |
Model Period Mean (complement) [Pg] |
Benchmark Period Mean (complement) [Pg] |
Bias [kg m-2] |
Bias Score [1] |
Spatial Distribution Score [1] |
Overall Score [1] |
|||
|---|---|---|---|---|---|---|---|---|---|---|---|---|
| Benchmark | [-] | 11.8 | ||||||||||
| CLM-CRUJRA | [-] | 6.85 | 6.24 | 10.5 | 1.37 | -7.38 | 0.608 | 0.323 | 0.466 | |||
| CLM-GSWP3 | [-] | 6.13 | 5.49 | 10.5 | 1.37 | -8.63 | 0.592 | 0.348 | 0.470 | |||
| CLM-Princeton | [-] | 7.46 | 6.70 | 10.5 | 1.37 | -6.59 | 0.622 | 0.387 | 0.504 | |||
| ISBA-CTRIP-CRUJRA | [-] | 8.86 | 8.29 | 11.7 | 0.0445 | 0.101 | -5.19 | 0.672 | 0.496 | 0.584 | ||
| ISBA-CTRIP-GSWP3 | [-] | 8.40 | 7.81 | 11.7 | 0.0379 | 0.101 | -5.94 | 0.650 | 0.461 | 0.555 | ||
| ISBA-CTRIP-Princeton | [-] | 10.4 | 9.61 | 11.7 | 0.0429 | 0.101 | -3.27 | 0.661 | 0.556 | 0.608 | ||
| JSBACH-CRUJRA | [-] | 4.96 | 3.81 | 8.45 | 3.40 | -10.3 | 0.542 | 0.174 | 0.358 | |||
| JSBACH-GSWP3 | [-] | 3.98 | 3.07 | 8.45 | 3.40 | -12.0 | 0.520 | 0.124 | 0.322 | |||
| JSBACH-Princeton | [-] | 4.91 | 3.67 | 8.45 | 3.40 | -10.7 | 0.538 | 0.149 | 0.344 | |||
| Mean-CRUJRA | [-] | 6.85 | 6.24 | 10.5 | 1.37 | -7.38 | 0.608 | 0.323 | 0.466 | |||
| Mean-GSWP3 | [-] | 6.13 | 5.49 | 10.5 | 1.37 | -8.63 | 0.592 | 0.348 | 0.470 | |||
| Mean-Princeton | [-] | 7.46 | 6.70 | 10.5 | 1.37 | -6.59 | 0.622 | 0.387 | 0.504 |
Download Data |
Period Mean (original grids) [Pg] |
Model Period Mean (intersection) [Pg] |
Benchmark Period Mean (intersection) [Pg] |
Model Period Mean (complement) [Pg] |
Benchmark Period Mean (complement) [Pg] |
Bias [kg m-2] |
Bias Score [1] |
Spatial Distribution Score [1] |
Overall Score [1] |
|||
|---|---|---|---|---|---|---|---|---|---|---|---|---|
| Benchmark | [-] | 194. | ||||||||||
| CLM-CRUJRA | [-] | 188. | 186. | 187. | 0.472 | 6.90 | -0.0877 | 0.694 | 0.924 | 0.809 | ||
| CLM-GSWP3 | [-] | 148. | 147. | 187. | 0.368 | 6.90 | -2.61 | 0.681 | 0.900 | 0.791 | ||
| CLM-Princeton | [-] | 206. | 204. | 187. | 0.420 | 6.90 | 1.08 | 0.688 | 0.859 | 0.773 | ||
| ISBA-CTRIP-CRUJRA | [-] | 349. | 340. | 193. | 1.65 | 0.388 | 9.23 | 0.507 | 0.827 | 0.667 | ||
| ISBA-CTRIP-GSWP3 | [-] | 312. | 303. | 193. | 1.62 | 0.388 | 6.90 | 0.555 | 0.898 | 0.726 | ||
| ISBA-CTRIP-Princeton | [-] | 398. | 387. | 193. | 2.08 | 0.388 | 12.2 | 0.457 | 0.715 | 0.586 | ||
| JSBACH-CRUJRA | [-] | 91.7 | 89.0 | 166. | 0.374 | 27.7 | -5.50 | 0.627 | 0.637 | 0.632 | ||
| JSBACH-GSWP3 | [-] | 113. | 109. | 166. | 0.418 | 27.7 | -4.07 | 0.686 | 0.565 | 0.625 | ||
| JSBACH-Princeton | [-] | 111. | 108. | 166. | 0.411 | 27.7 | -4.17 | 0.680 | 0.677 | 0.679 | ||
| Mean-CRUJRA | [-] | 188. | 186. | 187. | 0.472 | 6.90 | -0.0877 | 0.694 | 0.924 | 0.809 | ||
| Mean-GSWP3 | [-] | 148. | 147. | 187. | 0.368 | 6.90 | -2.61 | 0.681 | 0.900 | 0.791 | ||
| Mean-Princeton | [-] | 206. | 204. | 187. | 0.420 | 6.90 | 1.08 | 0.688 | 0.859 | 0.773 |
Download Data |
Period Mean (original grids) [Pg] |
Model Period Mean (intersection) [Pg] |
Benchmark Period Mean (intersection) [Pg] |
Model Period Mean (complement) [Pg] |
Benchmark Period Mean (complement) [Pg] |
Bias [kg m-2] |
Bias Score [1] |
Spatial Distribution Score [1] |
Overall Score [1] |
|||
|---|---|---|---|---|---|---|---|---|---|---|---|---|
| Benchmark | [-] | 66.4 | ||||||||||
| CLM-CRUJRA | [-] | 46.4 | 45.7 | 62.2 | 0.0179 | 4.20 | -3.46 | 0.716 | 0.402 | 0.559 | ||
| CLM-GSWP3 | [-] | 39.7 | 39.3 | 62.2 | 0.0174 | 4.20 | -4.80 | 0.675 | 0.356 | 0.516 | ||
| CLM-Princeton | [-] | 45.9 | 45.4 | 62.2 | 0.0190 | 4.20 | -3.53 | 0.714 | 0.470 | 0.592 | ||
| ISBA-CTRIP-CRUJRA | [-] | 58.6 | 57.9 | 66.0 | 0.0672 | 0.391 | -1.54 | 0.742 | 0.372 | 0.557 | ||
| ISBA-CTRIP-GSWP3 | [-] | 52.0 | 51.7 | 66.0 | 0.0698 | 0.391 | -2.76 | 0.726 | 0.370 | 0.548 | ||
| ISBA-CTRIP-Princeton | [-] | 54.4 | 53.6 | 66.0 | 0.0697 | 0.391 | -2.40 | 0.725 | 0.435 | 0.580 | ||
| JSBACH-CRUJRA | [-] | 26.4 | 24.3 | 49.7 | 16.7 | -6.55 | 0.609 | 0.0488 | 0.329 | |||
| JSBACH-GSWP3 | [-] | 22.2 | 20.4 | 49.7 | 16.7 | -7.57 | 0.564 | 0.0344 | 0.299 | |||
| JSBACH-Princeton | [-] | 24.3 | 22.4 | 49.7 | 16.7 | -7.06 | 0.587 | 0.0450 | 0.316 | |||
| Mean-CRUJRA | [-] | 46.4 | 45.7 | 62.2 | 0.0179 | 4.20 | -3.46 | 0.716 | 0.402 | 0.559 | ||
| Mean-GSWP3 | [-] | 39.7 | 39.3 | 62.2 | 0.0174 | 4.20 | -4.80 | 0.675 | 0.356 | 0.516 | ||
| Mean-Princeton | [-] | 45.9 | 45.4 | 62.2 | 0.0190 | 4.20 | -3.53 | 0.714 | 0.470 | 0.592 |
Download Data |
Period Mean (original grids) [Pg] |
Model Period Mean (intersection) [Pg] |
Benchmark Period Mean (intersection) [Pg] |
Model Period Mean (complement) [Pg] |
Benchmark Period Mean (complement) [Pg] |
Bias [kg m-2] |
Bias Score [1] |
Spatial Distribution Score [1] |
Overall Score [1] |
|||
|---|---|---|---|---|---|---|---|---|---|---|---|---|
| Benchmark | [-] | 333. | ||||||||||
| CLM-CRUJRA | [-] | 289. | 286. | 318. | 0.757 | 14.4 | -0.947 | 0.652 | 0.908 | 0.780 | ||
| CLM-GSWP3 | [-] | 221. | 219. | 318. | 0.753 | 14.4 | -2.85 | 0.639 | 0.889 | 0.764 | ||
| CLM-Princeton | [-] | 287. | 285. | 318. | 0.863 | 14.4 | -0.962 | 0.655 | 0.910 | 0.783 | ||
| ISBA-CTRIP-CRUJRA | [-] | 450. | 455. | 330. | 1.91 | 2.77 | 3.46 | 0.637 | 0.906 | 0.771 | ||
| ISBA-CTRIP-GSWP3 | [-] | 381. | 387. | 330. | 1.74 | 2.77 | 1.57 | 0.702 | 0.875 | 0.789 | ||
| ISBA-CTRIP-Princeton | [-] | 432. | 438. | 330. | 1.98 | 2.77 | 2.98 | 0.649 | 0.920 | 0.784 | ||
| JSBACH-CRUJRA | [-] | 156. | 157. | 275. | 0.0957 | 57.9 | -3.79 | 0.650 | 0.568 | 0.609 | ||
| JSBACH-GSWP3 | [-] | 153. | 155. | 275. | 0.0974 | 57.9 | -3.87 | 0.647 | 0.408 | 0.528 | ||
| JSBACH-Princeton | [-] | 153. | 155. | 275. | 0.0949 | 57.9 | -3.86 | 0.648 | 0.519 | 0.583 | ||
| Mean-CRUJRA | [-] | 289. | 286. | 318. | 0.757 | 14.4 | -0.947 | 0.652 | 0.908 | 0.780 | ||
| Mean-GSWP3 | [-] | 221. | 219. | 318. | 0.753 | 14.4 | -2.85 | 0.639 | 0.889 | 0.764 | ||
| Mean-Princeton | [-] | 287. | 285. | 318. | 0.863 | 14.4 | -0.962 | 0.655 | 0.910 | 0.783 |
Download Data |
Period Mean (original grids) [Pg] |
Model Period Mean (intersection) [Pg] |
Benchmark Period Mean (intersection) [Pg] |
Model Period Mean (complement) [Pg] |
Benchmark Period Mean (complement) [Pg] |
Bias [kg m-2] |
Bias Score [1] |
Spatial Distribution Score [1] |
Overall Score [1] |
|||
|---|---|---|---|---|---|---|---|---|---|---|---|---|
| Benchmark | [-] | 162. | ||||||||||
| CLM-CRUJRA | [-] | 542. | 618. | 160. | 1.09 | 1.71 | 33.5 | 0.259 | 0.0675 | 0.163 | ||
| CLM-GSWP3 | [-] | 264. | 334. | 160. | 0.640 | 1.71 | 12.5 | 0.421 | 0.151 | 0.286 | ||
| CLM-Princeton | [-] | 769. | 874. | 160. | 1.67 | 1.71 | 51.9 | 0.211 | 0.0327 | 0.122 | ||
| ISBA-CTRIP-CRUJRA | [-] | 237. | 237. | 161. | 0.423 | 0.145 | 5.50 | 0.582 | 0.839 | 0.710 | ||
| ISBA-CTRIP-GSWP3 | [-] | 232. | 231. | 161. | 0.385 | 0.145 | 5.06 | 0.596 | 0.835 | 0.715 | ||
| ISBA-CTRIP-Princeton | [-] | 280. | 280. | 161. | 0.463 | 0.145 | 8.60 | 0.493 | 0.709 | 0.601 | ||
| JSBACH-CRUJRA | [-] | 67.0 | 122. | 149. | 0.176 | 13.0 | -2.06 | 0.653 | 0.824 | 0.739 | ||
| JSBACH-GSWP3 | [-] | 93.6 | 128. | 149. | 0.171 | 13.0 | -1.65 | 0.655 | 0.888 | 0.772 | ||
| JSBACH-Princeton | [-] | 73.4 | 115. | 149. | 0.158 | 13.0 | -2.58 | 0.650 | 0.778 | 0.714 | ||
| Mean-CRUJRA | [-] | 616. | 618. | 160. | 1.09 | 1.71 | 33.5 | 0.259 | 0.0675 | 0.163 | ||
| Mean-GSWP3 | [-] | 337. | 334. | 160. | 0.640 | 1.71 | 12.5 | 0.421 | 0.151 | 0.286 | ||
| Mean-Princeton | [-] | 872. | 875. | 160. | 1.67 | 1.71 | 51.9 | 0.211 | 0.0327 | 0.122 |
Download Data |
Period Mean (original grids) [Pg] |
Model Period Mean (intersection) [Pg] |
Benchmark Period Mean (intersection) [Pg] |
Model Period Mean (complement) [Pg] |
Benchmark Period Mean (complement) [Pg] |
Bias [kg m-2] |
Bias Score [1] |
Spatial Distribution Score [1] |
Overall Score [1] |
|||
|---|---|---|---|---|---|---|---|---|---|---|---|---|
| Benchmark | [-] | 153. | ||||||||||
| CLM-CRUJRA | [-] | 118. | 116. | 151. | 0.337 | 1.98 | -2.02 | 0.643 | 0.856 | 0.749 | ||
| CLM-GSWP3 | [-] | 99.6 | 97.3 | 151. | 0.330 | 1.98 | -3.15 | 0.624 | 0.882 | 0.753 | ||
| CLM-Princeton | [-] | 159. | 153. | 151. | 0.390 | 1.98 | 0.158 | 0.640 | 0.473 | 0.556 | ||
| ISBA-CTRIP-CRUJRA | [-] | 330. | 327. | 153. | 1.34 | 0.182 | 10.0 | 0.404 | 0.545 | 0.475 | ||
| ISBA-CTRIP-GSWP3 | [-] | 296. | 293. | 153. | 1.25 | 0.182 | 8.08 | 0.458 | 0.738 | 0.598 | ||
| ISBA-CTRIP-Princeton | [-] | 373. | 368. | 153. | 1.52 | 0.182 | 12.4 | 0.337 | 0.521 | 0.429 | ||
| JSBACH-CRUJRA | [-] | 43.5 | 43.2 | 142. | 0.0283 | 11.2 | -6.15 | 0.507 | 0.431 | 0.469 | ||
| JSBACH-GSWP3 | [-] | 74.3 | 74.0 | 142. | 0.0452 | 11.2 | -4.22 | 0.618 | 0.660 | 0.639 | ||
| JSBACH-Princeton | [-] | 58.9 | 58.7 | 142. | 0.0259 | 11.2 | -5.18 | 0.566 | 0.651 | 0.608 | ||
| Mean-CRUJRA | [-] | 118. | 116. | 151. | 0.337 | 1.98 | -2.02 | 0.643 | 0.856 | 0.749 | ||
| Mean-GSWP3 | [-] | 99.6 | 97.3 | 151. | 0.330 | 1.98 | -3.15 | 0.624 | 0.882 | 0.753 | ||
| Mean-Princeton | [-] | 159. | 153. | 151. | 0.390 | 1.98 | 0.158 | 0.640 | 0.473 | 0.556 |
Temporally integrated period mean