Mean State
Download Data |
Period Mean (original grids) [Pg] |
Model Period Mean (intersection) [Pg] |
Benchmark Period Mean (intersection) [Pg] |
Model Period Mean (complement) [Pg] |
Benchmark Period Mean (complement) [Pg] |
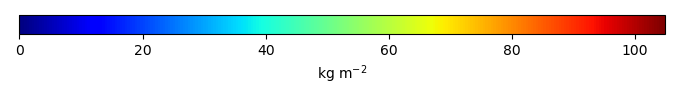
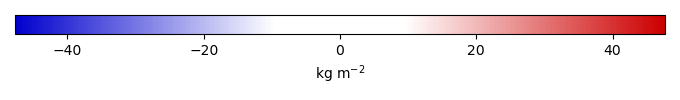
Bias [kg m-2] |
Bias Score [1] |
Spatial Distribution Score [1] |
Overall Score [1] |
|||
|---|---|---|---|---|---|---|---|---|---|---|---|---|
| Benchmark | [-] | 174. | ||||||||||
| CLM-CRUJRA | [-] | 319. | 210. | 174. | 107. | 0.372 | 4.65 | 0.594 | 0.711 | 0.652 | ||
| CLM-GSWP3 | [-] | 217. | 128. | 174. | 88.0 | 0.372 | -5.91 | 0.561 | 0.748 | 0.655 | ||
| CLM-Princeton | [-] | 430. | 289. | 174. | 138. | 0.372 | 14.8 | 0.591 | 0.226 | 0.409 | ||
| ISBA-CTRIP-CRUJRA | [-] | 285. | 166. | 174. | 122. | 0.00495 | -1.12 | 0.667 | 0.481 | 0.574 | ||
| ISBA-CTRIP-GSWP3 | [-] | 268. | 158. | 174. | 113. | 0.00495 | -2.15 | 0.660 | 0.437 | 0.549 | ||
| ISBA-CTRIP-Princeton | [-] | 359. | 208. | 174. | 153. | 0.00495 | 4.40 | 0.662 | 0.577 | 0.619 | ||
| JSBACH-CRUJRA | [-] | 123. | 73.0 | 169. | 49.8 | 4.99 | -12.8 | 0.540 | 0.131 | 0.336 | ||
| JSBACH-GSWP3 | [-] | 130. | 74.5 | 169. | 55.9 | 4.99 | -12.6 | 0.540 | 0.143 | 0.341 | ||
| JSBACH-Princeton | [-] | 131. | 73.5 | 169. | 57.8 | 4.99 | -12.7 | 0.542 | 0.130 | 0.336 | ||
| Mean-CRUJRA | [-] | 319. | 210. | 174. | 107. | 0.372 | 4.65 | 0.594 | 0.711 | 0.652 | ||
| Mean-GSWP3 | [-] | 217. | 128. | 174. | 88.0 | 0.372 | -5.91 | 0.561 | 0.748 | 0.655 | ||
| Mean-Princeton | [-] | 430. | 289. | 174. | 138. | 0.372 | 14.8 | 0.591 | 0.226 | 0.409 |
Download Data |
Period Mean (original grids) [Pg] |
Model Period Mean (intersection) [Pg] |
Benchmark Period Mean (intersection) [Pg] |
Model Period Mean (complement) [Pg] |
Benchmark Period Mean (complement) [Pg] |
Bias [kg m-2] |
Bias Score [1] |
Spatial Distribution Score [1] |
Overall Score [1] |
|||
|---|---|---|---|---|---|---|---|---|---|---|---|---|
| Benchmark | [-] | 473. | ||||||||||
| CLM-CRUJRA | [-] | 1.67e+03 | 801. | 472. | 921. | 0.940 | 14.7 | 0.509 | 0.353 | 0.431 | ||
| CLM-GSWP3 | [-] | 1.15e+03 | 441. | 472. | 730. | 0.940 | -1.43 | 0.536 | 0.642 | 0.589 | ||
| CLM-Princeton | [-] | 2.06e+03 | 1.14e+03 | 472. | 1.02e+03 | 0.940 | 29.6 | 0.479 | 0.160 | 0.320 | ||
| ISBA-CTRIP-CRUJRA | [-] | 2.00e+03 | 405. | 473. | 1.58e+03 | 0.0782 | -3.00 | 0.676 | 0.760 | 0.718 | ||
| ISBA-CTRIP-GSWP3 | [-] | 1.79e+03 | 390. | 473. | 1.39e+03 | 0.0782 | -3.70 | 0.670 | 0.741 | 0.705 | ||
| ISBA-CTRIP-Princeton | [-] | 2.18e+03 | 492. | 473. | 1.68e+03 | 0.0782 | 0.900 | 0.683 | 0.863 | 0.773 | ||
| JSBACH-CRUJRA | [-] | 555. | 191. | 453. | 419. | 19.8 | -12.1 | 0.534 | 0.314 | 0.424 | ||
| JSBACH-GSWP3 | [-] | 657. | 199. | 453. | 494. | 19.8 | -11.8 | 0.541 | 0.375 | 0.458 | ||
| JSBACH-Princeton | [-] | 601. | 186. | 453. | 457. | 19.8 | -12.4 | 0.531 | 0.287 | 0.409 | ||
| Mean-CRUJRA | [-] | 1.73e+03 | 801. | 472. | 921. | 0.940 | 14.7 | 0.509 | 0.353 | 0.431 | ||
| Mean-GSWP3 | [-] | 1.18e+03 | 441. | 472. | 730. | 0.940 | -1.43 | 0.536 | 0.642 | 0.589 | ||
| Mean-Princeton | [-] | 2.17e+03 | 1.14e+03 | 472. | 1.02e+03 | 0.940 | 29.6 | 0.479 | 0.160 | 0.320 |
Download Data |
Period Mean (original grids) [Pg] |
Model Period Mean (intersection) [Pg] |
Benchmark Period Mean (intersection) [Pg] |
Model Period Mean (complement) [Pg] |
Benchmark Period Mean (complement) [Pg] |
Bias [kg m-2] |
Bias Score [1] |
Spatial Distribution Score [1] |
Overall Score [1] |
|||
|---|---|---|---|---|---|---|---|---|---|---|---|---|
| Benchmark | [-] | 2.72 | ||||||||||
| CLM-CRUJRA | [-] | 25.8 | 3.75 | 2.72 | 21.5 | 3.20 | 0.569 | 0.125 | 0.347 | |||
| CLM-GSWP3 | [-] | 20.0 | 1.45 | 2.72 | 18.1 | -4.26 | 0.577 | 0.907 | 0.742 | |||
| CLM-Princeton | [-] | 37.0 | 5.29 | 2.72 | 30.8 | 8.18 | 0.495 | 0.0382 | 0.267 | |||
| ISBA-CTRIP-CRUJRA | [-] | 54.0 | 4.70 | 2.72 | 46.2 | 6.11 | 0.603 | 0.362 | 0.483 | |||
| ISBA-CTRIP-GSWP3 | [-] | 51.3 | 3.85 | 2.72 | 44.6 | 3.48 | 0.674 | 0.738 | 0.706 | |||
| ISBA-CTRIP-Princeton | [-] | 56.4 | 4.77 | 2.72 | 48.4 | 6.36 | 0.569 | 0.414 | 0.492 | |||
| JSBACH-CRUJRA | [-] | 10.5 | 0.267 | 2.72 | 10.0 | -8.12 | 0.406 | 0.156 | 0.281 | |||
| JSBACH-GSWP3 | [-] | 20.2 | 0.677 | 2.72 | 19.7 | -6.78 | 0.473 | 0.323 | 0.398 | |||
| JSBACH-Princeton | [-] | 13.7 | 0.331 | 2.72 | 12.9 | -7.92 | 0.416 | 0.204 | 0.310 | |||
| Mean-CRUJRA | [-] | 25.8 | 3.75 | 2.72 | 21.5 | 3.20 | 0.569 | 0.125 | 0.347 | |||
| Mean-GSWP3 | [-] | 20.0 | 1.45 | 2.72 | 18.1 | -4.26 | 0.577 | 0.907 | 0.742 | |||
| Mean-Princeton | [-] | 37.0 | 5.29 | 2.72 | 30.8 | 8.18 | 0.495 | 0.0382 | 0.267 |
Download Data |
Period Mean (original grids) [Pg] |
Model Period Mean (intersection) [Pg] |
Benchmark Period Mean (intersection) [Pg] |
Model Period Mean (complement) [Pg] |
Benchmark Period Mean (complement) [Pg] |
Bias [kg m-2] |
Bias Score [1] |
Spatial Distribution Score [1] |
Overall Score [1] |
|||
|---|---|---|---|---|---|---|---|---|---|---|---|---|
| Benchmark | [-] | 0.245 | ||||||||||
| CLM-CRUJRA | [-] | 6.85 | 0.239 | 0.245 | 6.00 | 0.617 | 0.551 | 0.293 | 0.422 | |||
| CLM-GSWP3 | [-] | 6.13 | 0.210 | 0.245 | 5.28 | -0.560 | 0.558 | 0.345 | 0.452 | |||
| CLM-Princeton | [-] | 7.46 | 0.317 | 0.245 | 6.38 | 3.66 | 0.540 | 0.456 | 0.498 | |||
| ISBA-CTRIP-CRUJRA | [-] | 8.86 | 0.246 | 0.245 | 8.08 | 0.354 | 0.614 | 0.0797 | 0.347 | |||
| ISBA-CTRIP-GSWP3 | [-] | 8.40 | 0.258 | 0.245 | 7.59 | 0.850 | 0.587 | 0.223 | 0.405 | |||
| ISBA-CTRIP-Princeton | [-] | 10.4 | 0.371 | 0.245 | 9.29 | 5.35 | 0.545 | 0.312 | 0.429 | |||
| JSBACH-CRUJRA | [-] | 4.96 | 0.277 | 0.236 | 3.53 | 0.00822 | 1.93 | 0.638 | 0.0345 | 0.336 | ||
| JSBACH-GSWP3 | [-] | 3.98 | 0.208 | 0.236 | 2.86 | 0.00822 | -0.952 | 0.590 | 0.150 | 0.370 | ||
| JSBACH-Princeton | [-] | 4.91 | 0.266 | 0.236 | 3.40 | 0.00822 | 1.48 | 0.621 | 0.0610 | 0.341 | ||
| Mean-CRUJRA | [-] | 6.85 | 0.239 | 0.245 | 6.00 | 0.617 | 0.551 | 0.293 | 0.422 | |||
| Mean-GSWP3 | [-] | 6.13 | 0.210 | 0.245 | 5.28 | -0.560 | 0.558 | 0.345 | 0.452 | |||
| Mean-Princeton | [-] | 7.46 | 0.317 | 0.245 | 6.38 | 3.66 | 0.540 | 0.456 | 0.498 |
Download Data |
Period Mean (original grids) [Pg] |
Model Period Mean (intersection) [Pg] |
Benchmark Period Mean (intersection) [Pg] |
Model Period Mean (complement) [Pg] |
Benchmark Period Mean (complement) [Pg] |
Bias [kg m-2] |
Bias Score [1] |
Spatial Distribution Score [1] |
Overall Score [1] |
|||
|---|---|---|---|---|---|---|---|---|---|---|---|---|
| Benchmark | [-] | 2.21 | ||||||||||
| CLM-CRUJRA | [-] | 188. | 3.12 | 2.21 | 184. | 0.00185 | 5.32 | 0.592 | 0.905 | 0.749 | ||
| CLM-GSWP3 | [-] | 148. | 2.69 | 2.21 | 145. | 0.00185 | 2.80 | 0.568 | 0.846 | 0.707 | ||
| CLM-Princeton | [-] | 206. | 4.11 | 2.21 | 201. | 0.00185 | 11.5 | 0.545 | 0.859 | 0.702 | ||
| ISBA-CTRIP-CRUJRA | [-] | 349. | 2.68 | 2.21 | 339. | 2.65 | 0.613 | 0.599 | 0.606 | |||
| ISBA-CTRIP-GSWP3 | [-] | 312. | 2.60 | 2.21 | 302. | 2.19 | 0.618 | 0.539 | 0.578 | |||
| ISBA-CTRIP-Princeton | [-] | 398. | 3.72 | 2.21 | 385. | 8.72 | 0.521 | 0.795 | 0.658 | |||
| JSBACH-CRUJRA | [-] | 91.7 | 1.64 | 2.21 | 87.7 | -3.05 | 0.605 | 0.186 | 0.395 | |||
| JSBACH-GSWP3 | [-] | 113. | 1.78 | 2.21 | 108. | -2.34 | 0.589 | 0.210 | 0.399 | |||
| JSBACH-Princeton | [-] | 111. | 1.76 | 2.21 | 106. | -2.36 | 0.609 | 0.161 | 0.385 | |||
| Mean-CRUJRA | [-] | 188. | 3.12 | 2.21 | 184. | 0.00185 | 5.32 | 0.592 | 0.905 | 0.749 | ||
| Mean-GSWP3 | [-] | 148. | 2.69 | 2.21 | 145. | 0.00185 | 2.80 | 0.568 | 0.846 | 0.707 | ||
| Mean-Princeton | [-] | 206. | 4.11 | 2.21 | 201. | 0.00185 | 11.5 | 0.545 | 0.859 | 0.702 |
Download Data |
Period Mean (original grids) [Pg] |
Model Period Mean (intersection) [Pg] |
Benchmark Period Mean (intersection) [Pg] |
Model Period Mean (complement) [Pg] |
Benchmark Period Mean (complement) [Pg] |
Bias [kg m-2] |
Bias Score [1] |
Spatial Distribution Score [1] |
Overall Score [1] |
|||
|---|---|---|---|---|---|---|---|---|---|---|---|---|
| Benchmark | [-] | 287. | ||||||||||
| CLM-CRUJRA | [-] | 542. | 577. | 287. | 42.2 | 0.702 | 21.1 | 0.453 | 0.290 | 0.372 | ||
| CLM-GSWP3 | [-] | 264. | 306. | 287. | 28.7 | 0.702 | 1.27 | 0.520 | 0.550 | 0.535 | ||
| CLM-Princeton | [-] | 769. | 823. | 287. | 52.8 | 0.702 | 38.8 | 0.410 | 0.143 | 0.277 | ||
| ISBA-CTRIP-CRUJRA | [-] | 237. | 221. | 287. | 16.2 | 0.0432 | -4.73 | 0.686 | 0.807 | 0.746 | ||
| ISBA-CTRIP-GSWP3 | [-] | 232. | 216. | 287. | 15.7 | 0.0432 | -5.14 | 0.678 | 0.802 | 0.740 | ||
| ISBA-CTRIP-Princeton | [-] | 280. | 262. | 287. | 18.3 | 0.0432 | -1.75 | 0.703 | 0.892 | 0.797 | ||
| JSBACH-CRUJRA | [-] | 67.0 | 115. | 273. | 7.60 | 14.3 | -12.1 | 0.532 | 0.385 | 0.459 | ||
| JSBACH-GSWP3 | [-] | 93.6 | 119. | 273. | 8.35 | 14.3 | -11.7 | 0.542 | 0.469 | 0.505 | ||
| JSBACH-Princeton | [-] | 73.4 | 108. | 273. | 6.94 | 14.3 | -12.5 | 0.525 | 0.344 | 0.435 | ||
| Mean-CRUJRA | [-] | 616. | 577. | 287. | 42.2 | 0.702 | 21.1 | 0.453 | 0.290 | 0.372 | ||
| Mean-GSWP3 | [-] | 337. | 306. | 287. | 28.8 | 0.702 | 1.27 | 0.520 | 0.550 | 0.535 | ||
| Mean-Princeton | [-] | 872. | 824. | 287. | 52.8 | 0.702 | 38.8 | 0.410 | 0.143 | 0.277 |
Download Data |
Period Mean (original grids) [Pg] |
Model Period Mean (intersection) [Pg] |
Benchmark Period Mean (intersection) [Pg] |
Model Period Mean (complement) [Pg] |
Benchmark Period Mean (complement) [Pg] |
Bias [kg m-2] |
Bias Score [1] |
Spatial Distribution Score [1] |
Overall Score [1] |
|||
|---|---|---|---|---|---|---|---|---|---|---|---|---|
| Benchmark | [-] | 5.26 | ||||||||||
| CLM-CRUJRA | [-] | 118. | 5.16 | 5.26 | 112. | -0.261 | 0.619 | 0.593 | 0.606 | |||
| CLM-GSWP3 | [-] | 99.6 | 2.27 | 5.26 | 95.3 | -6.39 | 0.534 | 0.799 | 0.666 | |||
| CLM-Princeton | [-] | 159. | 12.1 | 5.26 | 142. | 14.5 | 0.518 | 0.0684 | 0.293 | |||
| ISBA-CTRIP-CRUJRA | [-] | 330. | 9.73 | 5.26 | 319. | 9.53 | 0.490 | 0.773 | 0.632 | |||
| ISBA-CTRIP-GSWP3 | [-] | 296. | 8.70 | 5.26 | 285. | 7.20 | 0.551 | 0.946 | 0.748 | |||
| ISBA-CTRIP-Princeton | [-] | 373. | 12.2 | 5.26 | 358. | 14.6 | 0.391 | 0.737 | 0.564 | |||
| JSBACH-CRUJRA | [-] | 43.5 | 1.19 | 5.26 | 42.1 | -8.57 | 0.462 | 0.386 | 0.424 | |||
| JSBACH-GSWP3 | [-] | 74.3 | 1.83 | 5.26 | 72.2 | -7.22 | 0.506 | 0.423 | 0.464 | |||
| JSBACH-Princeton | [-] | 58.9 | 1.48 | 5.26 | 57.2 | -7.91 | 0.487 | 0.496 | 0.492 | |||
| Mean-CRUJRA | [-] | 118. | 5.16 | 5.26 | 112. | -0.261 | 0.619 | 0.593 | 0.606 | |||
| Mean-GSWP3 | [-] | 99.6 | 2.27 | 5.26 | 95.3 | -6.39 | 0.534 | 0.799 | 0.666 | |||
| Mean-Princeton | [-] | 159. | 12.1 | 5.26 | 142. | 14.5 | 0.518 | 0.0684 | 0.293 |
Temporally integrated period mean