Mean State
Download Data |
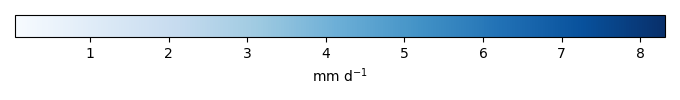
Period Mean (original grids) [mm d-1] |
Model Period Mean (intersection) [mm d-1] |
Benchmark Period Mean (intersection) [mm d-1] |
Model Period Mean (complement) [mm d-1] |
Benchmark Period Mean (complement) [mm d-1] |
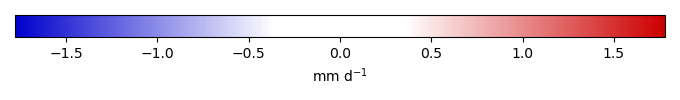
Bias [mm d-1] |
RMSE [mm d-1] |
Phase Shift [months] |
Bias Score [1] |
RMSE Score [1] |
Seasonal Cycle Score [1] |
Spatial Distribution Score [1] |
Overall Score [1] |
|||
|---|---|---|---|---|---|---|---|---|---|---|---|---|---|---|---|---|
| Benchmark | [-] | 1.92 | ||||||||||||||
| CLM-CRUJRA | [-] | 1.66 | 1.67 | 1.94 | 2.64 | -0.267 | 0.864 | 0.920 | 0.699 | 0.514 | 0.850 | 0.981 | 0.712 | |||
| CLM-GSWP3 | [-] | 1.74 | 1.76 | 1.92 | 2.66 | -0.154 | 0.755 | 0.727 | 0.740 | 0.568 | 0.883 | 0.924 | 0.737 | |||
| CLM-Princeton | [-] | 1.62 | 1.63 | 1.91 | 2.66 | -0.283 | 0.799 | 0.796 | 0.702 | 0.554 | 0.872 | 0.977 | 0.732 | |||
| ISBA-CTRIP-CRUJRA | [-] | 1.67 | 1.66 | 1.92 | 2.56 | -0.254 | 0.746 | 0.823 | 0.714 | 0.577 | 0.869 | 0.975 | 0.742 | |||
| ISBA-CTRIP-GSWP3 | [-] | 1.75 | 1.76 | 1.92 | 2.56 | -0.164 | 0.736 | 0.782 | 0.734 | 0.584 | 0.872 | 0.947 | 0.744 | |||
| ISBA-CTRIP-Princeton | [-] | 1.62 | 1.62 | 1.92 | 2.56 | -0.300 | 0.811 | 0.803 | 0.695 | 0.552 | 0.868 | 0.973 | 0.728 | |||
| JSBACH-CRUJRA | [-] | 1.64 | 1.64 | 1.90 | 2.44 | -0.257 | 0.757 | 0.778 | 0.717 | 0.568 | 0.875 | 0.971 | 0.740 | |||
| JSBACH-GSWP3 | [-] | 1.77 | 1.76 | 1.90 | 2.44 | -0.134 | 0.626 | 0.697 | 0.764 | 0.631 | 0.884 | 0.948 | 0.771 | |||
| JSBACH-Princeton | [-] | 1.61 | 1.61 | 1.90 | 2.44 | -0.289 | 0.803 | 0.785 | 0.704 | 0.545 | 0.874 | 0.972 | 0.728 | |||
| Mean-CRUJRA | [-] | 1.65 | 1.68 | 1.94 | 2.82 | -0.262 | 0.770 | 0.903 | 0.713 | 0.562 | 0.850 | 0.974 | 0.732 | |||
| Mean-GSWP3 | [-] | 1.73 | 1.77 | 1.92 | 2.93 | -0.153 | 0.620 | 0.696 | 0.762 | 0.632 | 0.886 | 0.977 | 0.778 | |||
| Mean-Princeton | [-] | 1.59 | 1.62 | 1.92 | 2.93 | -0.294 | 0.771 | 0.757 | 0.704 | 0.569 | 0.877 | 0.968 | 0.737 |
Download Data |
Period Mean (original grids) [mm d-1] |
Model Period Mean (intersection) [mm d-1] |
Benchmark Period Mean (intersection) [mm d-1] |
Model Period Mean (complement) [mm d-1] |
Benchmark Period Mean (complement) [mm d-1] |
Bias [mm d-1] |
RMSE [mm d-1] |
Phase Shift [months] |
Bias Score [1] |
RMSE Score [1] |
Seasonal Cycle Score [1] |
Spatial Distribution Score [1] |
Overall Score [1] |
|||
|---|---|---|---|---|---|---|---|---|---|---|---|---|---|---|---|---|
| Benchmark | [-] | 2.46 | ||||||||||||||
| CLM-CRUJRA | [-] | 2.39 | 2.29 | 2.41 | 3.32 | -0.118 | 1.22 | 0.970 | 0.771 | 0.522 | 0.871 | 0.982 | 0.734 | |||
| CLM-GSWP3 | [-] | 2.38 | 2.32 | 2.41 | 3.36 | -0.0824 | 1.10 | 0.737 | 0.783 | 0.566 | 0.898 | 0.978 | 0.758 | |||
| CLM-Princeton | [-] | 2.31 | 2.22 | 2.41 | 3.38 | -0.193 | 1.13 | 0.863 | 0.773 | 0.552 | 0.889 | 0.984 | 0.750 | |||
| ISBA-CTRIP-CRUJRA | [-] | 2.32 | 2.31 | 2.44 | 3.56 | -0.129 | 1.04 | 0.847 | 0.782 | 0.584 | 0.889 | 0.984 | 0.765 | |||
| ISBA-CTRIP-GSWP3 | [-] | 2.35 | 2.35 | 2.44 | 3.56 | -0.0916 | 1.14 | 0.786 | 0.772 | 0.563 | 0.885 | 0.975 | 0.752 | |||
| ISBA-CTRIP-Princeton | [-] | 2.25 | 2.24 | 2.44 | 3.56 | -0.195 | 1.18 | 0.879 | 0.765 | 0.542 | 0.884 | 0.982 | 0.743 | |||
| JSBACH-CRUJRA | [-] | 2.22 | 2.15 | 2.32 | 3.27 | -0.168 | 0.994 | 0.827 | 0.799 | 0.583 | 0.896 | 0.987 | 0.769 | |||
| JSBACH-GSWP3 | [-] | 2.25 | 2.21 | 2.32 | 3.27 | -0.108 | 0.819 | 0.644 | 0.824 | 0.650 | 0.914 | 0.988 | 0.805 | |||
| JSBACH-Princeton | [-] | 2.17 | 2.11 | 2.32 | 3.27 | -0.212 | 1.03 | 0.799 | 0.791 | 0.569 | 0.900 | 0.986 | 0.763 | |||
| Mean-CRUJRA | [-] | 2.35 | 2.35 | 2.46 | 3.20 | -0.109 | 1.09 | 0.894 | 0.779 | 0.570 | 0.879 | 0.985 | 0.756 | |||
| Mean-GSWP3 | [-] | 2.36 | 2.36 | 2.45 | 3.17 | -0.0866 | 0.965 | 0.685 | 0.798 | 0.616 | 0.904 | 0.985 | 0.784 | |||
| Mean-Princeton | [-] | 2.26 | 2.26 | 2.45 | 3.17 | -0.194 | 1.09 | 0.830 | 0.778 | 0.568 | 0.893 | 0.986 | 0.759 |
Download Data |
Period Mean (original grids) [mm d-1] |
Model Period Mean (intersection) [mm d-1] |
Benchmark Period Mean (intersection) [mm d-1] |
Model Period Mean (complement) [mm d-1] |
Benchmark Period Mean (complement) [mm d-1] |
Bias [mm d-1] |
RMSE [mm d-1] |
Phase Shift [months] |
Bias Score [1] |
RMSE Score [1] |
Seasonal Cycle Score [1] |
Spatial Distribution Score [1] |
Overall Score [1] |
|||
|---|---|---|---|---|---|---|---|---|---|---|---|---|---|---|---|---|
| Benchmark | [-] | 0.700 | ||||||||||||||
| CLM-CRUJRA | [-] | 0.674 | 0.669 | 0.708 | 0.954 | -0.0357 | 0.620 | 1.03 | 0.846 | 0.549 | 0.913 | 0.975 | 0.767 | |||
| CLM-GSWP3 | [-] | 0.646 | 0.641 | 0.692 | 1.02 | -0.0490 | 0.566 | 0.726 | 0.840 | 0.581 | 0.926 | 0.971 | 0.780 | |||
| CLM-Princeton | [-] | 0.604 | 0.600 | 0.694 | 1.02 | -0.0905 | 0.590 | 0.899 | 0.831 | 0.564 | 0.923 | 0.975 | 0.771 | |||
| ISBA-CTRIP-CRUJRA | [-] | 0.694 | 0.679 | 0.697 | 1.11 | -0.0129 | 0.562 | 0.885 | 0.843 | 0.592 | 0.939 | 0.940 | 0.781 | |||
| ISBA-CTRIP-GSWP3 | [-] | 0.674 | 0.657 | 0.697 | 1.11 | -0.0346 | 0.578 | 0.744 | 0.832 | 0.579 | 0.926 | 0.953 | 0.774 | |||
| ISBA-CTRIP-Princeton | [-] | 0.640 | 0.622 | 0.698 | 1.12 | -0.0698 | 0.622 | 0.896 | 0.825 | 0.551 | 0.924 | 0.947 | 0.759 | |||
| JSBACH-CRUJRA | [-] | 0.668 | 0.671 | 0.692 | 0.792 | -0.0207 | 0.533 | 0.884 | 0.857 | 0.598 | 0.939 | 0.981 | 0.794 | |||
| JSBACH-GSWP3 | [-] | 0.648 | 0.653 | 0.692 | 0.792 | -0.0392 | 0.460 | 0.626 | 0.851 | 0.651 | 0.944 | 0.975 | 0.814 | |||
| JSBACH-Princeton | [-] | 0.604 | 0.608 | 0.692 | 0.792 | -0.0843 | 0.559 | 0.789 | 0.836 | 0.580 | 0.941 | 0.978 | 0.783 | |||
| Mean-CRUJRA | [-] | 0.700 | 0.695 | 0.716 | 0.724 | -0.0201 | 0.563 | 0.938 | 0.849 | 0.593 | 0.922 | 0.953 | 0.782 | |||
| Mean-GSWP3 | [-] | 0.667 | 0.662 | 0.699 | 0.727 | -0.0367 | 0.493 | 0.667 | 0.848 | 0.632 | 0.937 | 0.967 | 0.803 | |||
| Mean-Princeton | [-] | 0.632 | 0.628 | 0.699 | 0.728 | -0.0718 | 0.568 | 0.861 | 0.837 | 0.583 | 0.929 | 0.952 | 0.777 |
Download Data |
Period Mean (original grids) [mm d-1] |
Model Period Mean (intersection) [mm d-1] |
Benchmark Period Mean (intersection) [mm d-1] |
Model Period Mean (complement) [mm d-1] |
Benchmark Period Mean (complement) [mm d-1] |
Bias [mm d-1] |
RMSE [mm d-1] |
Phase Shift [months] |
Bias Score [1] |
RMSE Score [1] |
Seasonal Cycle Score [1] |
Spatial Distribution Score [1] |
Overall Score [1] |
|||
|---|---|---|---|---|---|---|---|---|---|---|---|---|---|---|---|---|
| Benchmark | [-] | 0.656 | ||||||||||||||
| CLM-CRUJRA | [-] | 0.599 | 0.597 | 0.655 | 0.989 | -0.0537 | 0.495 | 1.22 | 0.732 | 0.481 | 0.807 | 0.966 | 0.693 | |||
| CLM-GSWP3 | [-] | 0.564 | 0.562 | 0.657 | 1.04 | -0.0869 | 0.451 | 0.799 | 0.730 | 0.531 | 0.883 | 0.919 | 0.719 | |||
| CLM-Princeton | [-] | 0.566 | 0.563 | 0.654 | 1.06 | -0.0875 | 0.474 | 1.08 | 0.739 | 0.508 | 0.814 | 0.963 | 0.707 | |||
| ISBA-CTRIP-CRUJRA | [-] | 0.621 | 0.618 | 0.656 | 1.01 | -0.0382 | 0.409 | 0.965 | 0.747 | 0.565 | 0.831 | 0.970 | 0.735 | |||
| ISBA-CTRIP-GSWP3 | [-] | 0.587 | 0.574 | 0.656 | 1.01 | -0.0823 | 0.444 | 0.847 | 0.724 | 0.549 | 0.876 | 0.907 | 0.721 | |||
| ISBA-CTRIP-Princeton | [-] | 0.574 | 0.569 | 0.656 | 1.04 | -0.0865 | 0.478 | 1.02 | 0.728 | 0.508 | 0.823 | 0.961 | 0.706 | |||
| JSBACH-CRUJRA | [-] | 0.621 | 0.617 | 0.647 | 0.908 | -0.0320 | 0.425 | 1.04 | 0.761 | 0.546 | 0.815 | 0.974 | 0.728 | |||
| JSBACH-GSWP3 | [-] | 0.582 | 0.572 | 0.647 | 0.908 | -0.0784 | 0.375 | 0.724 | 0.760 | 0.594 | 0.894 | 0.953 | 0.759 | |||
| JSBACH-Princeton | [-] | 0.572 | 0.567 | 0.647 | 0.908 | -0.0816 | 0.454 | 0.987 | 0.752 | 0.515 | 0.824 | 0.973 | 0.716 | |||
| Mean-CRUJRA | [-] | 0.607 | 0.597 | 0.649 | 1.01 | -0.0519 | 0.410 | 1.03 | 0.750 | 0.548 | 0.838 | 0.972 | 0.731 | |||
| Mean-GSWP3 | [-] | 0.580 | 0.567 | 0.655 | 0.981 | -0.0886 | 0.374 | 0.739 | 0.757 | 0.600 | 0.892 | 0.937 | 0.757 | |||
| Mean-Princeton | [-] | 0.575 | 0.564 | 0.655 | 0.986 | -0.0913 | 0.434 | 0.994 | 0.751 | 0.539 | 0.826 | 0.976 | 0.726 |
Download Data |
Period Mean (original grids) [mm d-1] |
Model Period Mean (intersection) [mm d-1] |
Benchmark Period Mean (intersection) [mm d-1] |
Model Period Mean (complement) [mm d-1] |
Benchmark Period Mean (complement) [mm d-1] |
Bias [mm d-1] |
RMSE [mm d-1] |
Phase Shift [months] |
Bias Score [1] |
RMSE Score [1] |
Seasonal Cycle Score [1] |
Spatial Distribution Score [1] |
Overall Score [1] |
|||
|---|---|---|---|---|---|---|---|---|---|---|---|---|---|---|---|---|
| Benchmark | [-] | 6.99 | ||||||||||||||
| CLM-CRUJRA | [-] | 5.53 | 5.60 | 6.73 | 6.40 | -1.19 | 3.35 | 0.824 | 0.583 | 0.492 | 0.897 | 0.587 | 0.610 | |||
| CLM-GSWP3 | [-] | 6.54 | 6.58 | 6.97 | 6.69 | -0.470 | 3.06 | 0.868 | 0.590 | 0.574 | 0.879 | 0.457 | 0.615 | |||
| CLM-Princeton | [-] | 5.58 | 5.54 | 7.04 | 6.73 | -1.57 | 3.33 | 0.778 | 0.587 | 0.538 | 0.891 | 0.621 | 0.635 | |||
| ISBA-CTRIP-CRUJRA | [-] | 5.39 | 5.53 | 6.95 | 6.75 | -1.33 | 3.05 | 0.891 | 0.621 | 0.549 | 0.880 | 0.627 | 0.645 | |||
| ISBA-CTRIP-GSWP3 | [-] | 6.74 | 6.45 | 6.95 | 6.75 | -0.430 | 2.99 | 0.809 | 0.605 | 0.574 | 0.898 | 0.437 | 0.617 | |||
| ISBA-CTRIP-Princeton | [-] | 5.40 | 5.34 | 7.00 | 6.80 | -1.57 | 3.33 | 0.733 | 0.570 | 0.533 | 0.894 | 0.571 | 0.620 | |||
| JSBACH-CRUJRA | [-] | 5.07 | 5.25 | 6.99 | 6.85 | -1.73 | 3.12 | 0.684 | 0.617 | 0.531 | 0.913 | 0.827 | 0.684 | |||
| JSBACH-GSWP3 | [-] | 6.71 | 6.58 | 6.99 | 6.85 | -0.412 | 2.14 | 0.780 | 0.708 | 0.661 | 0.888 | 0.726 | 0.729 | |||
| JSBACH-Princeton | [-] | 5.03 | 5.25 | 6.99 | 6.85 | -1.73 | 3.14 | 0.681 | 0.623 | 0.525 | 0.914 | 0.825 | 0.682 | |||
| Mean-CRUJRA | [-] | 5.49 | 5.50 | 6.71 | 6.14 | -1.21 | 2.76 | 0.789 | 0.632 | 0.544 | 0.906 | 0.770 | 0.679 | |||
| Mean-GSWP3 | [-] | 6.47 | 6.37 | 6.95 | 6.61 | -0.583 | 2.41 | 0.756 | 0.671 | 0.634 | 0.895 | 0.677 | 0.702 | |||
| Mean-Princeton | [-] | 5.46 | 5.46 | 7.00 | 6.65 | -1.54 | 3.04 | 0.747 | 0.606 | 0.552 | 0.891 | 0.771 | 0.675 |
Download Data |
Period Mean (original grids) [mm d-1] |
Model Period Mean (intersection) [mm d-1] |
Benchmark Period Mean (intersection) [mm d-1] |
Model Period Mean (complement) [mm d-1] |
Benchmark Period Mean (complement) [mm d-1] |
Bias [mm d-1] |
RMSE [mm d-1] |
Phase Shift [months] |
Bias Score [1] |
RMSE Score [1] |
Seasonal Cycle Score [1] |
Spatial Distribution Score [1] |
Overall Score [1] |
|||
|---|---|---|---|---|---|---|---|---|---|---|---|---|---|---|---|---|
| Benchmark | [-] | 3.10 | ||||||||||||||
| CLM-CRUJRA | [-] | 2.70 | 2.70 | 3.04 | 3.72 | -0.339 | 1.24 | 1.37 | 0.737 | 0.528 | 0.804 | 0.953 | 0.710 | |||
| CLM-GSWP3 | [-] | 2.91 | 2.90 | 3.07 | 3.80 | -0.173 | 1.12 | 1.06 | 0.765 | 0.581 | 0.847 | 0.914 | 0.738 | |||
| CLM-Princeton | [-] | 2.67 | 2.68 | 3.07 | 3.82 | -0.399 | 1.17 | 1.12 | 0.733 | 0.569 | 0.839 | 0.967 | 0.736 | |||
| ISBA-CTRIP-CRUJRA | [-] | 2.70 | 2.73 | 3.09 | 3.67 | -0.354 | 1.02 | 1.07 | 0.748 | 0.615 | 0.847 | 0.970 | 0.759 | |||
| ISBA-CTRIP-GSWP3 | [-] | 2.88 | 2.91 | 3.09 | 3.67 | -0.182 | 1.09 | 1.08 | 0.767 | 0.598 | 0.842 | 0.912 | 0.743 | |||
| ISBA-CTRIP-Princeton | [-] | 2.66 | 2.69 | 3.09 | 3.67 | -0.406 | 1.19 | 1.12 | 0.729 | 0.566 | 0.839 | 0.964 | 0.733 | |||
| JSBACH-CRUJRA | [-] | 2.65 | 2.63 | 3.01 | 3.64 | -0.381 | 1.02 | 1.06 | 0.757 | 0.609 | 0.846 | 0.985 | 0.761 | |||
| JSBACH-GSWP3 | [-] | 2.83 | 2.82 | 3.01 | 3.64 | -0.192 | 0.853 | 0.945 | 0.806 | 0.662 | 0.862 | 0.967 | 0.792 | |||
| JSBACH-Princeton | [-] | 2.63 | 2.61 | 3.01 | 3.64 | -0.405 | 1.12 | 1.06 | 0.750 | 0.571 | 0.847 | 0.985 | 0.745 | |||
| Mean-CRUJRA | [-] | 2.70 | 2.73 | 3.06 | 3.37 | -0.328 | 1.02 | 1.19 | 0.757 | 0.601 | 0.830 | 0.974 | 0.753 | |||
| Mean-GSWP3 | [-] | 2.87 | 2.90 | 3.09 | 3.44 | -0.187 | 0.906 | 0.946 | 0.791 | 0.650 | 0.865 | 0.954 | 0.782 | |||
| Mean-Princeton | [-] | 2.65 | 2.68 | 3.09 | 3.44 | -0.411 | 1.09 | 1.04 | 0.743 | 0.596 | 0.852 | 0.982 | 0.754 |
Download Data |
Period Mean (original grids) [mm d-1] |
Model Period Mean (intersection) [mm d-1] |
Benchmark Period Mean (intersection) [mm d-1] |
Model Period Mean (complement) [mm d-1] |
Benchmark Period Mean (complement) [mm d-1] |
Bias [mm d-1] |
RMSE [mm d-1] |
Phase Shift [months] |
Bias Score [1] |
RMSE Score [1] |
Seasonal Cycle Score [1] |
Spatial Distribution Score [1] |
Overall Score [1] |
|||
|---|---|---|---|---|---|---|---|---|---|---|---|---|---|---|---|---|
| Benchmark | [-] | 8.43 | ||||||||||||||
| CLM-CRUJRA | [-] | 8.25 | 8.34 | 8.58 | 8.19 | -0.247 | 3.46 | 1.32 | 0.723 | 0.426 | 0.810 | 0.862 | 0.650 | |||
| CLM-GSWP3 | [-] | 8.31 | 8.33 | 8.45 | 7.97 | -0.128 | 3.01 | 1.01 | 0.716 | 0.482 | 0.856 | 0.725 | 0.652 | |||
| CLM-Princeton | [-] | 7.99 | 8.03 | 8.47 | 7.95 | -0.451 | 3.23 | 1.21 | 0.716 | 0.439 | 0.832 | 0.840 | 0.653 | |||
| ISBA-CTRIP-CRUJRA | [-] | 8.16 | 8.08 | 8.44 | 8.18 | -0.364 | 2.93 | 1.21 | 0.723 | 0.480 | 0.834 | 0.869 | 0.677 | |||
| ISBA-CTRIP-GSWP3 | [-] | 8.40 | 8.22 | 8.44 | 8.18 | -0.243 | 3.21 | 1.22 | 0.689 | 0.465 | 0.822 | 0.662 | 0.621 | |||
| ISBA-CTRIP-Princeton | [-] | 8.07 | 7.97 | 8.44 | 8.15 | -0.484 | 3.36 | 1.20 | 0.704 | 0.428 | 0.831 | 0.803 | 0.639 | |||
| JSBACH-CRUJRA | [-] | 7.87 | 7.92 | 8.46 | 8.35 | -0.555 | 3.02 | 1.24 | 0.766 | 0.456 | 0.823 | 0.959 | 0.692 | |||
| JSBACH-GSWP3 | [-] | 8.08 | 8.10 | 8.46 | 8.35 | -0.394 | 2.11 | 0.924 | 0.788 | 0.581 | 0.867 | 0.949 | 0.753 | |||
| JSBACH-Princeton | [-] | 7.81 | 7.88 | 8.46 | 8.35 | -0.599 | 2.90 | 1.16 | 0.758 | 0.462 | 0.840 | 0.955 | 0.695 | |||
| Mean-CRUJRA | [-] | 8.23 | 8.31 | 8.62 | 8.49 | -0.311 | 3.00 | 1.32 | 0.736 | 0.468 | 0.802 | 0.944 | 0.684 | |||
| Mean-GSWP3 | [-] | 8.03 | 8.16 | 8.44 | 8.12 | -0.276 | 2.56 | 0.978 | 0.741 | 0.534 | 0.859 | 0.872 | 0.708 | |||
| Mean-Princeton | [-] | 7.90 | 7.97 | 8.44 | 8.08 | -0.465 | 3.07 | 1.13 | 0.728 | 0.452 | 0.843 | 0.903 | 0.676 |
Download Data |
Period Mean (original grids) [mm d-1] |
Model Period Mean (intersection) [mm d-1] |
Benchmark Period Mean (intersection) [mm d-1] |
Model Period Mean (complement) [mm d-1] |
Benchmark Period Mean (complement) [mm d-1] |
Bias [mm d-1] |
RMSE [mm d-1] |
Phase Shift [months] |
Bias Score [1] |
RMSE Score [1] |
Seasonal Cycle Score [1] |
Spatial Distribution Score [1] |
Overall Score [1] |
|||
|---|---|---|---|---|---|---|---|---|---|---|---|---|---|---|---|---|
| Benchmark | [-] | 4.15 | ||||||||||||||
| CLM-CRUJRA | [-] | 4.13 | 4.11 | 4.12 | 4.33 | -0.00135 | 2.05 | 0.689 | 0.826 | 0.551 | 0.915 | 0.951 | 0.759 | |||
| CLM-GSWP3 | [-] | 4.10 | 4.08 | 4.13 | 4.32 | -0.0446 | 1.82 | 0.566 | 0.831 | 0.592 | 0.930 | 0.949 | 0.779 | |||
| CLM-Princeton | [-] | 4.05 | 4.03 | 4.14 | 4.33 | -0.112 | 1.85 | 0.620 | 0.836 | 0.580 | 0.929 | 0.961 | 0.777 | |||
| ISBA-CTRIP-CRUJRA | [-] | 4.13 | 4.11 | 4.14 | 4.45 | -0.0298 | 1.72 | 0.615 | 0.836 | 0.608 | 0.927 | 0.959 | 0.787 | |||
| ISBA-CTRIP-GSWP3 | [-] | 4.13 | 4.08 | 4.14 | 4.45 | -0.0611 | 1.90 | 0.634 | 0.820 | 0.583 | 0.918 | 0.941 | 0.769 | |||
| ISBA-CTRIP-Princeton | [-] | 4.10 | 4.04 | 4.15 | 4.44 | -0.104 | 1.95 | 0.658 | 0.827 | 0.566 | 0.922 | 0.956 | 0.767 | |||
| JSBACH-CRUJRA | [-] | 3.99 | 3.98 | 4.12 | 4.31 | -0.147 | 1.69 | 0.552 | 0.855 | 0.607 | 0.941 | 0.980 | 0.798 | |||
| JSBACH-GSWP3 | [-] | 3.99 | 3.99 | 4.12 | 4.31 | -0.136 | 1.35 | 0.459 | 0.865 | 0.677 | 0.947 | 0.987 | 0.830 | |||
| JSBACH-Princeton | [-] | 3.95 | 3.93 | 4.12 | 4.31 | -0.193 | 1.69 | 0.554 | 0.853 | 0.605 | 0.942 | 0.981 | 0.797 | |||
| Mean-CRUJRA | [-] | 4.18 | 4.16 | 4.15 | 4.37 | 0.00937 | 1.83 | 0.644 | 0.828 | 0.590 | 0.921 | 0.960 | 0.778 | |||
| Mean-GSWP3 | [-] | 4.11 | 4.10 | 4.14 | 4.36 | -0.0457 | 1.57 | 0.520 | 0.841 | 0.638 | 0.935 | 0.966 | 0.804 | |||
| Mean-Princeton | [-] | 4.07 | 4.05 | 4.15 | 4.35 | -0.0981 | 1.77 | 0.604 | 0.839 | 0.593 | 0.930 | 0.968 | 0.785 |
Download Data |
Period Mean (original grids) [mm d-1] |
Model Period Mean (intersection) [mm d-1] |
Benchmark Period Mean (intersection) [mm d-1] |
Model Period Mean (complement) [mm d-1] |
Benchmark Period Mean (complement) [mm d-1] |
Bias [mm d-1] |
RMSE [mm d-1] |
Phase Shift [months] |
Bias Score [1] |
RMSE Score [1] |
Seasonal Cycle Score [1] |
Spatial Distribution Score [1] |
Overall Score [1] |
|||
|---|---|---|---|---|---|---|---|---|---|---|---|---|---|---|---|---|
| Benchmark | [-] | 1.09 | ||||||||||||||
| CLM-CRUJRA | [-] | 0.978 | 0.992 | 1.13 | 0.931 | -0.142 | 0.617 | 0.828 | 0.690 | 0.523 | 0.886 | 0.959 | 0.716 | |||
| CLM-GSWP3 | [-] | 0.401 | 1.09 | 1.10 | 0.925 | -0.0111 | 0.592 | 0.641 | 0.741 | 0.537 | 0.903 | 0.959 | 0.736 | |||
| CLM-Princeton | [-] | 0.866 | 0.954 | 1.10 | 0.925 | -0.139 | 0.582 | 0.812 | 0.662 | 0.546 | 0.882 | 0.949 | 0.717 | |||
| ISBA-CTRIP-CRUJRA | [-] | 0.970 | 0.973 | 1.10 | 0.959 | -0.121 | 0.541 | 0.791 | 0.692 | 0.557 | 0.877 | 0.957 | 0.728 | |||
| ISBA-CTRIP-GSWP3 | [-] | 1.07 | 1.08 | 1.10 | 0.959 | -0.0163 | 0.578 | 0.648 | 0.736 | 0.552 | 0.903 | 0.959 | 0.740 | |||
| ISBA-CTRIP-Princeton | [-] | 0.934 | 0.940 | 1.09 | 0.955 | -0.150 | 0.583 | 0.821 | 0.657 | 0.545 | 0.880 | 0.949 | 0.715 | |||
| JSBACH-CRUJRA | [-] | 0.927 | 0.995 | 1.11 | 0.920 | -0.118 | 0.545 | 0.814 | 0.692 | 0.560 | 0.881 | 0.955 | 0.730 | |||
| JSBACH-GSWP3 | [-] | 0.682 | 1.11 | 1.11 | 0.920 | -0.00403 | 0.541 | 0.601 | 0.757 | 0.584 | 0.911 | 0.965 | 0.760 | |||
| JSBACH-Princeton | [-] | 0.915 | 0.978 | 1.11 | 0.920 | -0.135 | 0.600 | 0.788 | 0.666 | 0.538 | 0.886 | 0.949 | 0.716 | |||
| Mean-CRUJRA | [-] | 0.973 | 0.988 | 1.13 | 0.905 | -0.143 | 0.564 | 0.824 | 0.695 | 0.562 | 0.887 | 0.959 | 0.733 | |||
| Mean-GSWP3 | [-] | 1.07 | 1.08 | 1.10 | 0.855 | -0.0141 | 0.531 | 0.600 | 0.756 | 0.581 | 0.910 | 0.968 | 0.759 | |||
| Mean-Princeton | [-] | 0.929 | 0.944 | 1.09 | 0.853 | -0.149 | 0.568 | 0.813 | 0.662 | 0.555 | 0.882 | 0.951 | 0.721 |
Download Data |
Period Mean (original grids) [mm d-1] |
Model Period Mean (intersection) [mm d-1] |
Benchmark Period Mean (intersection) [mm d-1] |
Model Period Mean (complement) [mm d-1] |
Benchmark Period Mean (complement) [mm d-1] |
Bias [mm d-1] |
RMSE [mm d-1] |
Phase Shift [months] |
Bias Score [1] |
RMSE Score [1] |
Seasonal Cycle Score [1] |
Spatial Distribution Score [1] |
Overall Score [1] |
|||
|---|---|---|---|---|---|---|---|---|---|---|---|---|---|---|---|---|
| Benchmark | [-] | 1.73 | ||||||||||||||
| CLM-CRUJRA | [-] | 1.52 | 1.50 | 1.72 | 2.15 | -0.218 | 0.869 | 1.01 | 0.756 | 0.546 | 0.851 | 0.980 | 0.736 | |||
| CLM-GSWP3 | [-] | 1.62 | 1.61 | 1.73 | 2.14 | -0.119 | 0.789 | 0.719 | 0.785 | 0.587 | 0.897 | 0.947 | 0.761 | |||
| CLM-Princeton | [-] | 1.50 | 1.48 | 1.73 | 2.14 | -0.245 | 0.818 | 0.934 | 0.757 | 0.578 | 0.868 | 0.981 | 0.753 | |||
| ISBA-CTRIP-CRUJRA | [-] | 1.54 | 1.52 | 1.73 | 2.38 | -0.210 | 0.691 | 0.934 | 0.771 | 0.636 | 0.864 | 0.982 | 0.778 | |||
| ISBA-CTRIP-GSWP3 | [-] | 1.62 | 1.62 | 1.73 | 2.38 | -0.117 | 0.748 | 0.758 | 0.783 | 0.609 | 0.887 | 0.945 | 0.767 | |||
| ISBA-CTRIP-Princeton | [-] | 1.51 | 1.50 | 1.73 | 2.38 | -0.233 | 0.820 | 0.968 | 0.755 | 0.579 | 0.861 | 0.972 | 0.749 | |||
| JSBACH-CRUJRA | [-] | 1.51 | 1.49 | 1.70 | 2.13 | -0.207 | 0.714 | 0.907 | 0.773 | 0.620 | 0.866 | 0.983 | 0.773 | |||
| JSBACH-GSWP3 | [-] | 1.59 | 1.59 | 1.70 | 2.13 | -0.108 | 0.623 | 0.645 | 0.810 | 0.664 | 0.908 | 0.962 | 0.801 | |||
| JSBACH-Princeton | [-] | 1.48 | 1.47 | 1.70 | 2.13 | -0.236 | 0.795 | 0.920 | 0.764 | 0.581 | 0.867 | 0.981 | 0.755 | |||
| Mean-CRUJRA | [-] | 1.52 | 1.52 | 1.72 | 2.21 | -0.205 | 0.709 | 0.890 | 0.772 | 0.622 | 0.867 | 0.985 | 0.773 | |||
| Mean-GSWP3 | [-] | 1.63 | 1.62 | 1.73 | 2.18 | -0.113 | 0.633 | 0.643 | 0.810 | 0.660 | 0.908 | 0.968 | 0.801 | |||
| Mean-Princeton | [-] | 1.50 | 1.50 | 1.73 | 2.18 | -0.234 | 0.750 | 0.888 | 0.769 | 0.608 | 0.872 | 0.985 | 0.768 |
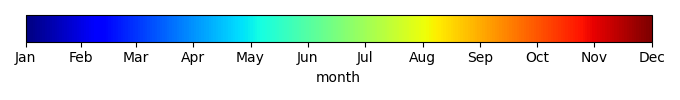
Temporally integrated period mean