Mean State
Download Data |
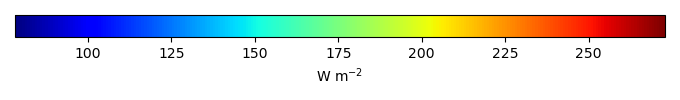
Period Mean (original grids) [W m-2] |
Model Period Mean (intersection) [W m-2] |
Benchmark Period Mean (intersection) [W m-2] |
Model Period Mean (complement) [W m-2] |
Benchmark Period Mean (complement) [W m-2] |
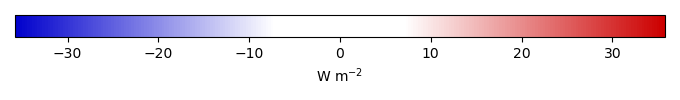
Bias [W m-2] |
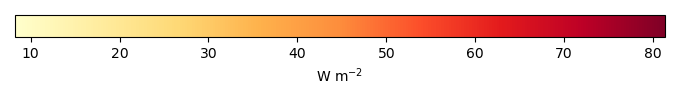
RMSE [W m-2] |
Phase Shift [months] |
Bias Score [1] |
RMSE Score [1] |
Seasonal Cycle Score [1] |
Spatial Distribution Score [1] |
Overall Score [1] |
|||
|---|---|---|---|---|---|---|---|---|---|---|---|---|---|---|---|---|
| Benchmark | [-] | 133. | ||||||||||||||
| CLM-CRUJRA | [-] | 140. | 140. | 133. | 108. | 7.21 | 22.6 | 0.270 | 0.858 | 0.780 | 0.979 | 0.970 | 0.873 | |||
| CLM-GSWP3 | [-] | 132. | 132. | 133. | 108. | -0.893 | 16.1 | 0.236 | 0.939 | 0.815 | 0.982 | 0.994 | 0.909 | |||
| CLM-Princeton | [-] | 129. | 129. | 133. | 108. | -3.65 | 15.2 | 0.212 | 0.916 | 0.830 | 0.983 | 0.998 | 0.911 | |||
| ISBA-CTRIP-CRUJRA | [-] | 139. | 140. | 133. | 93.6 | 6.91 | 22.3 | 0.277 | 0.858 | 0.784 | 0.979 | 0.964 | 0.874 | |||
| ISBA-CTRIP-GSWP3 | [-] | 131. | 132. | 133. | -0.985 | 15.8 | 0.244 | 0.937 | 0.818 | 0.981 | 0.994 | 0.910 | ||||
| ISBA-CTRIP-Princeton | [-] | 130. | 130. | 133. | 93.7 | -2.90 | 15.5 | 0.219 | 0.917 | 0.828 | 0.982 | 0.998 | 0.911 | |||
| JSBACH-CRUJRA | [-] | 142. | 143. | 134. | 112. | 9.18 | 23.2 | 0.299 | 0.843 | 0.783 | 0.977 | 0.971 | 0.871 | |||
| JSBACH-GSWP3 | [-] | 131. | 133. | 134. | 112. | -0.925 | 15.7 | 0.251 | 0.937 | 0.820 | 0.981 | 0.994 | 0.910 | |||
| JSBACH-Princeton | [-] | 132. | 134. | 134. | 112. | -0.328 | 15.7 | 0.235 | 0.929 | 0.821 | 0.980 | 0.998 | 0.910 | |||
| Mean-CRUJRA | [-] | 140. | 141. | 133. | 93.4 | 7.77 | 22.5 | 0.280 | 0.854 | 0.784 | 0.979 | 0.969 | 0.874 | |||
| Mean-GSWP3 | [-] | 131. | 132. | 133. | -0.956 | 15.5 | 0.241 | 0.941 | 0.821 | 0.981 | 0.995 | 0.911 | ||||
| Mean-Princeton | [-] | 130. | 130. | 133. | 93.7 | -2.56 | 14.6 | 0.209 | 0.926 | 0.834 | 0.983 | 0.998 | 0.915 |
Download Data |
Period Mean (original grids) [W m-2] |
Model Period Mean (intersection) [W m-2] |
Benchmark Period Mean (intersection) [W m-2] |
Model Period Mean (complement) [W m-2] |
Benchmark Period Mean (complement) [W m-2] |
Bias [W m-2] |
RMSE [W m-2] |
Phase Shift [months] |
Bias Score [1] |
RMSE Score [1] |
Seasonal Cycle Score [1] |
Spatial Distribution Score [1] |
Overall Score [1] |
|||
|---|---|---|---|---|---|---|---|---|---|---|---|---|---|---|---|---|
| Benchmark | [-] | 191. | ||||||||||||||
| CLM-CRUJRA | [-] | 202. | 196. | 191. | 195. | 4.92 | 22.4 | 0.577 | 0.757 | 0.704 | 0.939 | 0.996 | 0.820 | |||
| CLM-GSWP3 | [-] | 194. | 187. | 191. | 195. | -3.35 | 17.8 | 0.423 | 0.856 | 0.712 | 0.958 | 0.999 | 0.847 | |||
| CLM-Princeton | [-] | 192. | 186. | 191. | 195. | -5.09 | 16.5 | 0.418 | 0.826 | 0.745 | 0.956 | 0.999 | 0.854 | |||
| ISBA-CTRIP-CRUJRA | [-] | 196. | 196. | 191. | 202. | 4.87 | 22.3 | 0.580 | 0.756 | 0.707 | 0.938 | 0.996 | 0.821 | |||
| ISBA-CTRIP-GSWP3 | [-] | 188. | 188. | 191. | -2.83 | 17.7 | 0.415 | 0.850 | 0.714 | 0.959 | 0.999 | 0.847 | ||||
| ISBA-CTRIP-Princeton | [-] | 187. | 187. | 191. | 202. | -4.11 | 16.7 | 0.421 | 0.829 | 0.742 | 0.956 | 0.999 | 0.854 | |||
| JSBACH-CRUJRA | [-] | 201. | 197. | 191. | 190. | 5.65 | 22.6 | 0.595 | 0.752 | 0.708 | 0.938 | 0.995 | 0.820 | |||
| JSBACH-GSWP3 | [-] | 192. | 187. | 191. | 190. | -3.79 | 17.4 | 0.436 | 0.854 | 0.720 | 0.956 | 0.999 | 0.850 | |||
| JSBACH-Princeton | [-] | 193. | 188. | 191. | 190. | -2.84 | 17.2 | 0.430 | 0.838 | 0.726 | 0.956 | 0.999 | 0.849 | |||
| Mean-CRUJRA | [-] | 196. | 196. | 191. | 208. | 5.28 | 22.2 | 0.575 | 0.757 | 0.709 | 0.939 | 0.996 | 0.822 | |||
| Mean-GSWP3 | [-] | 188. | 188. | 191. | 216. | -2.96 | 17.1 | 0.391 | 0.860 | 0.721 | 0.962 | 0.999 | 0.852 | |||
| Mean-Princeton | [-] | 187. | 187. | 191. | 208. | -4.15 | 15.8 | 0.392 | 0.841 | 0.751 | 0.960 | 0.999 | 0.860 |
Download Data |
Period Mean (original grids) [W m-2] |
Model Period Mean (intersection) [W m-2] |
Benchmark Period Mean (intersection) [W m-2] |
Model Period Mean (complement) [W m-2] |
Benchmark Period Mean (complement) [W m-2] |
Bias [W m-2] |
RMSE [W m-2] |
Phase Shift [months] |
Bias Score [1] |
RMSE Score [1] |
Seasonal Cycle Score [1] |
Spatial Distribution Score [1] |
Overall Score [1] |
|||
|---|---|---|---|---|---|---|---|---|---|---|---|---|---|---|---|---|
| Benchmark | [-] | 251. | ||||||||||||||
| CLM-CRUJRA | [-] | 247. | 247. | 251. | 242. | -4.26 | 18.3 | 0.448 | 0.772 | 0.740 | 0.962 | 0.996 | 0.842 | |||
| CLM-GSWP3 | [-] | 242. | 242. | 251. | 242. | -9.39 | 17.9 | 0.301 | 0.793 | 0.736 | 0.975 | 0.995 | 0.847 | |||
| CLM-Princeton | [-] | 240. | 240. | 251. | 242. | -11.2 | 17.7 | 0.301 | 0.755 | 0.768 | 0.974 | 0.996 | 0.852 | |||
| ISBA-CTRIP-CRUJRA | [-] | 247. | 247. | 251. | 248. | -4.42 | 18.2 | 0.439 | 0.769 | 0.744 | 0.962 | 0.996 | 0.843 | |||
| ISBA-CTRIP-GSWP3 | [-] | 242. | 242. | 251. | -9.23 | 17.9 | 0.308 | 0.789 | 0.737 | 0.974 | 0.996 | 0.847 | ||||
| ISBA-CTRIP-Princeton | [-] | 241. | 241. | 251. | 248. | -9.93 | 17.4 | 0.323 | 0.763 | 0.763 | 0.971 | 0.996 | 0.851 | |||
| JSBACH-CRUJRA | [-] | 248. | 248. | 252. | 242. | -3.88 | 17.9 | 0.466 | 0.775 | 0.743 | 0.960 | 0.996 | 0.843 | |||
| JSBACH-GSWP3 | [-] | 243. | 242. | 252. | 242. | -9.77 | 17.4 | 0.319 | 0.791 | 0.743 | 0.973 | 0.993 | 0.848 | |||
| JSBACH-Princeton | [-] | 243. | 243. | 252. | 242. | -9.34 | 17.5 | 0.308 | 0.777 | 0.749 | 0.973 | 0.996 | 0.849 | |||
| Mean-CRUJRA | [-] | 247. | 247. | 251. | 251. | -4.23 | 17.8 | 0.448 | 0.774 | 0.748 | 0.961 | 0.997 | 0.845 | |||
| Mean-GSWP3 | [-] | 242. | 242. | 251. | 251. | -9.28 | 17.3 | 0.281 | 0.794 | 0.746 | 0.977 | 0.997 | 0.852 | |||
| Mean-Princeton | [-] | 241. | 241. | 251. | 251. | -10.2 | 16.8 | 0.295 | 0.770 | 0.774 | 0.974 | 0.998 | 0.858 |
Download Data |
Period Mean (original grids) [W m-2] |
Model Period Mean (intersection) [W m-2] |
Benchmark Period Mean (intersection) [W m-2] |
Model Period Mean (complement) [W m-2] |
Benchmark Period Mean (complement) [W m-2] |
Bias [W m-2] |
RMSE [W m-2] |
Phase Shift [months] |
Bias Score [1] |
RMSE Score [1] |
Seasonal Cycle Score [1] |
Spatial Distribution Score [1] |
Overall Score [1] |
|||
|---|---|---|---|---|---|---|---|---|---|---|---|---|---|---|---|---|
| Benchmark | [-] | 207. | ||||||||||||||
| CLM-CRUJRA | [-] | 204. | 203. | 207. | 205. | -4.21 | 20.4 | 0.419 | 0.854 | 0.822 | 0.971 | 0.753 | 0.844 | |||
| CLM-GSWP3 | [-] | 197. | 196. | 207. | 205. | -11.6 | 20.2 | 0.230 | 0.856 | 0.811 | 0.984 | 0.990 | 0.890 | |||
| CLM-Princeton | [-] | 199. | 198. | 207. | 205. | -9.52 | 16.3 | 0.225 | 0.873 | 0.853 | 0.983 | 0.999 | 0.912 | |||
| ISBA-CTRIP-CRUJRA | [-] | 202. | 202. | 207. | 205. | -5.37 | 20.3 | 0.390 | 0.853 | 0.823 | 0.973 | 0.787 | 0.852 | |||
| ISBA-CTRIP-GSWP3 | [-] | 196. | 196. | 207. | -11.4 | 20.0 | 0.239 | 0.857 | 0.814 | 0.984 | 0.992 | 0.892 | ||||
| ISBA-CTRIP-Princeton | [-] | 199. | 199. | 207. | 204. | -8.41 | 16.2 | 0.235 | 0.879 | 0.851 | 0.982 | 0.999 | 0.913 | |||
| JSBACH-CRUJRA | [-] | 206. | 205. | 208. | 196. | -3.04 | 20.6 | 0.396 | 0.855 | 0.821 | 0.973 | 0.750 | 0.844 | |||
| JSBACH-GSWP3 | [-] | 198. | 196. | 208. | 196. | -11.8 | 20.2 | 0.233 | 0.852 | 0.814 | 0.984 | 0.990 | 0.891 | |||
| JSBACH-Princeton | [-] | 204. | 201. | 208. | 196. | -6.54 | 16.4 | 0.288 | 0.894 | 0.840 | 0.978 | 0.999 | 0.910 | |||
| Mean-CRUJRA | [-] | 203. | 203. | 207. | 214. | -4.07 | 20.1 | 0.382 | 0.856 | 0.826 | 0.974 | 0.765 | 0.849 | |||
| Mean-GSWP3 | [-] | 196. | 196. | 207. | 219. | -11.5 | 19.7 | 0.226 | 0.857 | 0.817 | 0.985 | 0.991 | 0.893 | |||
| Mean-Princeton | [-] | 199. | 199. | 207. | 213. | -8.36 | 15.4 | 0.211 | 0.886 | 0.856 | 0.984 | 1.00 | 0.917 |
Download Data |
Period Mean (original grids) [W m-2] |
Model Period Mean (intersection) [W m-2] |
Benchmark Period Mean (intersection) [W m-2] |
Model Period Mean (complement) [W m-2] |
Benchmark Period Mean (complement) [W m-2] |
Bias [W m-2] |
RMSE [W m-2] |
Phase Shift [months] |
Bias Score [1] |
RMSE Score [1] |
Seasonal Cycle Score [1] |
Spatial Distribution Score [1] |
Overall Score [1] |
|||
|---|---|---|---|---|---|---|---|---|---|---|---|---|---|---|---|---|
| Benchmark | [-] | 135. | ||||||||||||||
| CLM-CRUJRA | [-] | 162. | 166. | 139. | 116. | 27.5 | 33.5 | 0.880 | 0.506 | 0.643 | 0.876 | 0.996 | 0.733 | |||
| CLM-GSWP3 | [-] | 142. | 147. | 139. | 116. | 8.15 | 19.3 | 0.775 | 0.719 | 0.652 | 0.886 | 0.993 | 0.780 | |||
| CLM-Princeton | [-] | 142. | 146. | 138. | 116. | 8.13 | 17.4 | 0.520 | 0.720 | 0.696 | 0.939 | 0.994 | 0.809 | |||
| ISBA-CTRIP-CRUJRA | [-] | 158. | 163. | 136. | 115. | 26.8 | 33.2 | 0.707 | 0.537 | 0.664 | 0.901 | 0.997 | 0.753 | |||
| ISBA-CTRIP-GSWP3 | [-] | 138. | 143. | 135. | 7.30 | 18.1 | 0.481 | 0.761 | 0.682 | 0.934 | 0.998 | 0.812 | ||||
| ISBA-CTRIP-Princeton | [-] | 136. | 142. | 136. | 115. | 6.19 | 16.2 | 0.472 | 0.779 | 0.715 | 0.945 | 0.997 | 0.830 | |||
| JSBACH-CRUJRA | [-] | 172. | 170. | 140. | 126. | 29.2 | 36.1 | 0.813 | 0.461 | 0.607 | 0.889 | 0.997 | 0.712 | |||
| JSBACH-GSWP3 | [-] | 151. | 149. | 140. | 126. | 8.80 | 19.9 | 0.771 | 0.678 | 0.628 | 0.887 | 0.995 | 0.763 | |||
| JSBACH-Princeton | [-] | 153. | 152. | 140. | 126. | 11.3 | 21.6 | 0.651 | 0.642 | 0.632 | 0.907 | 0.997 | 0.762 | |||
| Mean-CRUJRA | [-] | 165. | 163. | 136. | 115. | 27.4 | 33.4 | 0.642 | 0.532 | 0.666 | 0.915 | 0.997 | 0.755 | |||
| Mean-GSWP3 | [-] | 144. | 143. | 135. | 7.79 | 17.6 | 0.514 | 0.761 | 0.691 | 0.925 | 0.996 | 0.813 | ||||
| Mean-Princeton | [-] | 144. | 143. | 136. | 115. | 7.40 | 15.9 | 0.431 | 0.764 | 0.730 | 0.947 | 0.994 | 0.833 |
Download Data |
Period Mean (original grids) [W m-2] |
Model Period Mean (intersection) [W m-2] |
Benchmark Period Mean (intersection) [W m-2] |
Model Period Mean (complement) [W m-2] |
Benchmark Period Mean (complement) [W m-2] |
Bias [W m-2] |
RMSE [W m-2] |
Phase Shift [months] |
Bias Score [1] |
RMSE Score [1] |
Seasonal Cycle Score [1] |
Spatial Distribution Score [1] |
Overall Score [1] |
|||
|---|---|---|---|---|---|---|---|---|---|---|---|---|---|---|---|---|
| Benchmark | [-] | 150. | ||||||||||||||
| CLM-CRUJRA | [-] | 170. | 170. | 151. | 131. | 18.8 | 27.3 | 0.382 | 0.732 | 0.765 | 0.968 | 0.989 | 0.844 | |||
| CLM-GSWP3 | [-] | 152. | 152. | 151. | 131. | 1.05 | 16.5 | 0.268 | 0.905 | 0.782 | 0.976 | 0.999 | 0.889 | |||
| CLM-Princeton | [-] | 151. | 151. | 151. | 131. | 0.523 | 13.6 | 0.246 | 0.897 | 0.822 | 0.977 | 0.999 | 0.904 | |||
| ISBA-CTRIP-CRUJRA | [-] | 169. | 169. | 150. | 122. | 18.9 | 27.1 | 0.381 | 0.732 | 0.768 | 0.967 | 0.988 | 0.845 | |||
| ISBA-CTRIP-GSWP3 | [-] | 151. | 151. | 150. | 1.33 | 16.1 | 0.290 | 0.903 | 0.788 | 0.976 | 0.998 | 0.891 | ||||
| ISBA-CTRIP-Princeton | [-] | 150. | 151. | 150. | 122. | 1.28 | 13.9 | 0.254 | 0.893 | 0.821 | 0.977 | 0.999 | 0.902 | |||
| JSBACH-CRUJRA | [-] | 171. | 171. | 151. | 143. | 20.1 | 28.3 | 0.417 | 0.717 | 0.764 | 0.964 | 0.986 | 0.839 | |||
| JSBACH-GSWP3 | [-] | 151. | 152. | 151. | 143. | 0.934 | 16.2 | 0.295 | 0.902 | 0.786 | 0.975 | 0.999 | 0.890 | |||
| JSBACH-Princeton | [-] | 153. | 154. | 151. | 143. | 3.04 | 15.8 | 0.258 | 0.889 | 0.796 | 0.977 | 0.999 | 0.891 | |||
| Mean-CRUJRA | [-] | 169. | 170. | 150. | 128. | 19.3 | 27.3 | 0.389 | 0.727 | 0.770 | 0.967 | 0.987 | 0.844 | |||
| Mean-GSWP3 | [-] | 151. | 151. | 150. | 137. | 1.25 | 15.6 | 0.273 | 0.910 | 0.792 | 0.977 | 0.999 | 0.894 | |||
| Mean-Princeton | [-] | 151. | 152. | 150. | 128. | 1.42 | 13.1 | 0.225 | 0.905 | 0.828 | 0.980 | 0.999 | 0.908 |
Download Data |
Period Mean (original grids) [W m-2] |
Model Period Mean (intersection) [W m-2] |
Benchmark Period Mean (intersection) [W m-2] |
Model Period Mean (complement) [W m-2] |
Benchmark Period Mean (complement) [W m-2] |
Bias [W m-2] |
RMSE [W m-2] |
Phase Shift [months] |
Bias Score [1] |
RMSE Score [1] |
Seasonal Cycle Score [1] |
Spatial Distribution Score [1] |
Overall Score [1] |
|||
|---|---|---|---|---|---|---|---|---|---|---|---|---|---|---|---|---|
| Benchmark | [-] | 196. | ||||||||||||||
| CLM-CRUJRA | [-] | 213. | 212. | 195. | 205. | 16.8 | 23.6 | 1.31 | 0.453 | 0.457 | 0.801 | 0.948 | 0.623 | |||
| CLM-GSWP3 | [-] | 197. | 196. | 195. | 205. | 1.32 | 16.7 | 1.18 | 0.762 | 0.437 | 0.814 | 0.975 | 0.685 | |||
| CLM-Princeton | [-] | 190. | 189. | 195. | 205. | -5.35 | 15.6 | 1.10 | 0.637 | 0.510 | 0.838 | 0.996 | 0.698 | |||
| ISBA-CTRIP-CRUJRA | [-] | 212. | 212. | 195. | 213. | 17.1 | 23.9 | 1.35 | 0.447 | 0.463 | 0.800 | 0.967 | 0.628 | |||
| ISBA-CTRIP-GSWP3 | [-] | 197. | 198. | 196. | 2.33 | 17.1 | 1.10 | 0.737 | 0.439 | 0.835 | 0.997 | 0.690 | ||||
| ISBA-CTRIP-Princeton | [-] | 190. | 190. | 195. | 213. | -4.80 | 15.9 | 1.04 | 0.646 | 0.506 | 0.848 | 0.999 | 0.701 | |||
| JSBACH-CRUJRA | [-] | 212. | 211. | 194. | 200. | 17.1 | 23.3 | 1.42 | 0.429 | 0.461 | 0.790 | 0.950 | 0.618 | |||
| JSBACH-GSWP3 | [-] | 194. | 195. | 194. | 200. | 0.763 | 15.5 | 1.25 | 0.767 | 0.452 | 0.808 | 0.925 | 0.681 | |||
| JSBACH-Princeton | [-] | 189. | 190. | 194. | 200. | -4.53 | 16.0 | 1.24 | 0.648 | 0.477 | 0.814 | 0.993 | 0.682 | |||
| Mean-CRUJRA | [-] | 213. | 212. | 195. | 214. | 17.0 | 23.7 | 1.36 | 0.449 | 0.465 | 0.801 | 0.954 | 0.627 | |||
| Mean-GSWP3 | [-] | 198. | 198. | 196. | 2.32 | 16.1 | 1.03 | 0.761 | 0.457 | 0.843 | 0.989 | 0.701 | ||||
| Mean-Princeton | [-] | 191. | 190. | 195. | 214. | -4.81 | 14.8 | 0.976 | 0.662 | 0.524 | 0.858 | 0.990 | 0.712 |
Download Data |
Period Mean (original grids) [W m-2] |
Model Period Mean (intersection) [W m-2] |
Benchmark Period Mean (intersection) [W m-2] |
Model Period Mean (complement) [W m-2] |
Benchmark Period Mean (complement) [W m-2] |
Bias [W m-2] |
RMSE [W m-2] |
Phase Shift [months] |
Bias Score [1] |
RMSE Score [1] |
Seasonal Cycle Score [1] |
Spatial Distribution Score [1] |
Overall Score [1] |
|||
|---|---|---|---|---|---|---|---|---|---|---|---|---|---|---|---|---|
| Benchmark | [-] | 215. | ||||||||||||||
| CLM-CRUJRA | [-] | 221. | 221. | 214. | 224. | 7.21 | 22.5 | 0.954 | 0.631 | 0.543 | 0.877 | 0.889 | 0.696 | |||
| CLM-GSWP3 | [-] | 215. | 215. | 214. | 224. | 0.875 | 17.1 | 0.671 | 0.815 | 0.549 | 0.923 | 0.994 | 0.766 | |||
| CLM-Princeton | [-] | 212. | 212. | 214. | 224. | -2.09 | 15.9 | 0.719 | 0.768 | 0.587 | 0.912 | 0.993 | 0.769 | |||
| ISBA-CTRIP-CRUJRA | [-] | 221. | 221. | 214. | 226. | 7.10 | 22.4 | 0.956 | 0.634 | 0.545 | 0.875 | 0.890 | 0.698 | |||
| ISBA-CTRIP-GSWP3 | [-] | 215. | 216. | 215. | 1.57 | 17.2 | 0.628 | 0.803 | 0.554 | 0.927 | 0.998 | 0.767 | ||||
| ISBA-CTRIP-Princeton | [-] | 213. | 214. | 214. | 226. | -0.653 | 16.2 | 0.690 | 0.768 | 0.585 | 0.916 | 0.998 | 0.770 | |||
| JSBACH-CRUJRA | [-] | 222. | 221. | 214. | 218. | 7.41 | 22.7 | 0.988 | 0.621 | 0.538 | 0.872 | 0.880 | 0.690 | |||
| JSBACH-GSWP3 | [-] | 215. | 215. | 214. | 218. | 0.571 | 16.7 | 0.708 | 0.812 | 0.551 | 0.917 | 0.990 | 0.764 | |||
| JSBACH-Princeton | [-] | 214. | 214. | 214. | 218. | -0.412 | 17.1 | 0.716 | 0.777 | 0.550 | 0.913 | 0.989 | 0.756 | |||
| Mean-CRUJRA | [-] | 222. | 222. | 214. | 226. | 7.34 | 22.2 | 0.931 | 0.635 | 0.548 | 0.880 | 0.885 | 0.699 | |||
| Mean-GSWP3 | [-] | 216. | 216. | 215. | 216. | 1.47 | 16.5 | 0.593 | 0.821 | 0.564 | 0.932 | 0.996 | 0.775 | |||
| Mean-Princeton | [-] | 213. | 213. | 214. | 226. | -1.09 | 15.2 | 0.652 | 0.789 | 0.598 | 0.922 | 0.993 | 0.780 |
Download Data |
Period Mean (original grids) [W m-2] |
Model Period Mean (intersection) [W m-2] |
Benchmark Period Mean (intersection) [W m-2] |
Model Period Mean (complement) [W m-2] |
Benchmark Period Mean (complement) [W m-2] |
Bias [W m-2] |
RMSE [W m-2] |
Phase Shift [months] |
Bias Score [1] |
RMSE Score [1] |
Seasonal Cycle Score [1] |
Spatial Distribution Score [1] |
Overall Score [1] |
|||
|---|---|---|---|---|---|---|---|---|---|---|---|---|---|---|---|---|
| Benchmark | [-] | 114. | ||||||||||||||
| CLM-CRUJRA | [-] | 118. | 111. | 114. | 102. | -2.69 | 25.1 | 0.576 | 0.932 | 0.787 | 0.957 | 0.971 | 0.887 | |||
| CLM-GSWP3 | [-] | 121. | 108. | 114. | 102. | -6.26 | 21.8 | 0.530 | 0.938 | 0.807 | 0.962 | 0.997 | 0.902 | |||
| CLM-Princeton | [-] | 128. | 107. | 114. | 102. | -7.58 | 23.2 | 0.478 | 0.898 | 0.808 | 0.967 | 0.877 | 0.872 | |||
| ISBA-CTRIP-CRUJRA | [-] | 112. | 111. | 114. | 94.5 | -2.54 | 24.9 | 0.550 | 0.932 | 0.788 | 0.959 | 0.971 | 0.888 | |||
| ISBA-CTRIP-GSWP3 | [-] | 108. | 107. | 114. | -6.48 | 21.4 | 0.522 | 0.936 | 0.810 | 0.962 | 0.996 | 0.903 | ||||
| ISBA-CTRIP-Princeton | [-] | 107. | 107. | 114. | 95.0 | -7.60 | 23.3 | 0.482 | 0.899 | 0.807 | 0.966 | 0.873 | 0.870 | |||
| JSBACH-CRUJRA | [-] | 119. | 114. | 115. | 103. | -0.785 | 25.4 | 0.598 | 0.922 | 0.787 | 0.954 | 0.979 | 0.886 | |||
| JSBACH-GSWP3 | [-] | 119. | 109. | 115. | 103. | -6.13 | 21.1 | 0.529 | 0.939 | 0.812 | 0.962 | 0.998 | 0.905 | |||
| JSBACH-Princeton | [-] | 122. | 111. | 115. | 103. | -3.87 | 21.8 | 0.505 | 0.924 | 0.812 | 0.965 | 0.892 | 0.881 | |||
| Mean-CRUJRA | [-] | 112. | 112. | 114. | 88.9 | -1.98 | 24.9 | 0.564 | 0.931 | 0.789 | 0.957 | 0.972 | 0.888 | |||
| Mean-GSWP3 | [-] | 107. | 108. | 114. | -6.47 | 21.3 | 0.518 | 0.938 | 0.812 | 0.962 | 0.997 | 0.904 | ||||
| Mean-Princeton | [-] | 107. | 107. | 114. | 89.5 | -7.00 | 22.5 | 0.465 | 0.905 | 0.812 | 0.967 | 0.884 | 0.876 |
Download Data |
Period Mean (original grids) [W m-2] |
Model Period Mean (intersection) [W m-2] |
Benchmark Period Mean (intersection) [W m-2] |
Model Period Mean (complement) [W m-2] |
Benchmark Period Mean (complement) [W m-2] |
Bias [W m-2] |
RMSE [W m-2] |
Phase Shift [months] |
Bias Score [1] |
RMSE Score [1] |
Seasonal Cycle Score [1] |
Spatial Distribution Score [1] |
Overall Score [1] |
|||
|---|---|---|---|---|---|---|---|---|---|---|---|---|---|---|---|---|
| Benchmark | [-] | 181. | ||||||||||||||
| CLM-CRUJRA | [-] | 190. | 190. | 181. | 181. | 8.82 | 22.4 | 0.357 | 0.807 | 0.798 | 0.973 | 0.921 | 0.860 | |||
| CLM-GSWP3 | [-] | 177. | 177. | 181. | 181. | -3.61 | 17.0 | 0.239 | 0.894 | 0.801 | 0.982 | 0.999 | 0.895 | |||
| CLM-Princeton | [-] | 178. | 178. | 181. | 181. | -2.95 | 14.3 | 0.223 | 0.893 | 0.837 | 0.982 | 0.999 | 0.910 | |||
| ISBA-CTRIP-CRUJRA | [-] | 190. | 189. | 181. | 171. | 8.50 | 22.0 | 0.374 | 0.809 | 0.803 | 0.973 | 0.923 | 0.862 | |||
| ISBA-CTRIP-GSWP3 | [-] | 178. | 177. | 181. | -3.55 | 16.8 | 0.241 | 0.893 | 0.806 | 0.982 | 0.999 | 0.897 | ||||
| ISBA-CTRIP-Princeton | [-] | 180. | 178. | 181. | 171. | -2.37 | 14.4 | 0.226 | 0.896 | 0.836 | 0.982 | 0.999 | 0.910 | |||
| JSBACH-CRUJRA | [-] | 191. | 191. | 181. | 177. | 9.95 | 23.1 | 0.372 | 0.796 | 0.796 | 0.972 | 0.906 | 0.853 | |||
| JSBACH-GSWP3 | [-] | 177. | 177. | 181. | 177. | -3.73 | 17.0 | 0.227 | 0.888 | 0.802 | 0.983 | 0.999 | 0.895 | |||
| JSBACH-Princeton | [-] | 181. | 181. | 181. | 177. | -0.309 | 16.0 | 0.226 | 0.894 | 0.813 | 0.981 | 0.999 | 0.900 | |||
| Mean-CRUJRA | [-] | 190. | 190. | 181. | 163. | 8.96 | 22.1 | 0.356 | 0.808 | 0.804 | 0.974 | 0.918 | 0.862 | |||
| Mean-GSWP3 | [-] | 177. | 177. | 181. | 158. | -3.65 | 16.3 | 0.210 | 0.898 | 0.809 | 0.985 | 0.999 | 0.900 | |||
| Mean-Princeton | [-] | 178. | 179. | 181. | 163. | -2.27 | 13.6 | 0.201 | 0.904 | 0.842 | 0.984 | 0.999 | 0.914 |
Temporally integrated period mean