Mean State
Download Data |
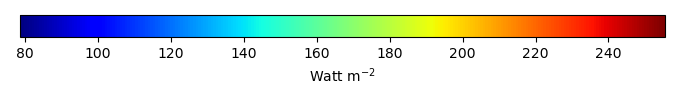
Period Mean (original grids) [Watt m-2] |
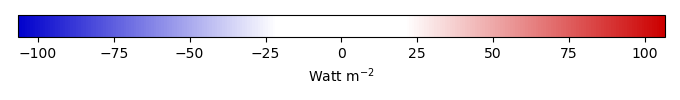
Bias [Watt m-2] |
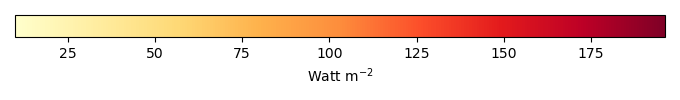
RMSE [Watt m-2] |
Phase Shift [months] |
Bias Score [1] |
RMSE Score [1] |
Seasonal Cycle Score [1] |
Overall Score [1] |
|||
|---|---|---|---|---|---|---|---|---|---|---|---|
| Benchmark | [-] | 181. | |||||||||
| CLM-CRUJRA | [-] | 187. | 4.92 | 25.1 | 0.523 | 0.749 | 0.718 | 0.944 | 0.782 | ||
| CLM-GSWP3 | [-] | 177. | -5.40 | 22.5 | 0.471 | 0.792 | 0.709 | 0.930 | 0.785 | ||
| CLM-Princeton | [-] | 176. | -6.45 | 20.3 | 0.572 | 0.808 | 0.731 | 0.916 | 0.797 | ||
| ISBA-CTRIP-CRUJRA | [-] | 186. | 4.13 | 25.1 | 0.575 | 0.752 | 0.716 | 0.936 | 0.780 | ||
| ISBA-CTRIP-GSWP3 | [-] | 177. | -5.62 | 22.8 | 0.496 | 0.782 | 0.709 | 0.921 | 0.780 | ||
| ISBA-CTRIP-Princeton | [-] | 177. | -5.88 | 21.1 | 0.573 | 0.797 | 0.727 | 0.916 | 0.792 | ||
| JSBACH-CRUJRA | [-] | 190. | 8.55 | 26.0 | 0.637 | 0.777 | 0.740 | 0.926 | 0.796 | ||
| JSBACH-GSWP3 | [-] | 179. | -2.92 | 22.0 | 0.541 | 0.839 | 0.732 | 0.911 | 0.803 | ||
| JSBACH-Princeton | [-] | 182. | -0.324 | 20.5 | 0.636 | 0.846 | 0.751 | 0.896 | 0.811 | ||
| Mean-CRUJRA | [-] | 187. | 5.06 | 25.5 | 0.549 | 0.745 | 0.717 | 0.942 | 0.780 | ||
| Mean-GSWP3 | [-] | 177. | -5.02 | 22.9 | 0.470 | 0.787 | 0.710 | 0.930 | 0.784 | ||
| Mean-Princeton | [-] | 177. | -5.51 | 20.6 | 0.520 | 0.803 | 0.729 | 0.919 | 0.795 |
Download Data |
Period Mean (original grids) [Watt m-2] |
Bias [Watt m-2] |
RMSE [Watt m-2] |
Phase Shift [months] |
Bias Score [1] |
RMSE Score [1] |
Seasonal Cycle Score [1] |
Overall Score [1] |
|||
|---|---|---|---|---|---|---|---|---|---|---|---|
| Benchmark | [-] | 249. | |||||||||
| CLM-CRUJRA | [-] | 239. | -3.72 | 18.3 | 0.514 | 0.791 | 0.759 | 0.946 | 0.814 | ||
| CLM-GSWP3 | [-] | 239. | -6.61 | 19.0 | 0.511 | 0.729 | 0.761 | 0.916 | 0.791 | ||
| CLM-Princeton | [-] | 241. | -3.97 | 18.8 | 0.511 | 0.728 | 0.761 | 0.916 | 0.792 | ||
| ISBA-CTRIP-CRUJRA | [-] | 235. | -14.8 | 28.0 | 1.02 | 0.693 | 0.756 | 0.846 | 0.762 | ||
| ISBA-CTRIP-GSWP3 | [-] | 238. | -12.9 | 22.9 | 0.874 | 0.618 | 0.755 | 0.856 | 0.746 | ||
| ISBA-CTRIP-Princeton | [-] | 242. | -9.03 | 23.0 | 0.729 | 0.632 | 0.753 | 0.892 | 0.757 | ||
| JSBACH-CRUJRA | [-] | 240. | -3.79 | 19.7 | 0.683 | 0.782 | 0.738 | 0.904 | 0.790 | ||
| JSBACH-GSWP3 | [-] | 239. | -6.22 | 21.6 | 0.681 | 0.713 | 0.729 | 0.874 | 0.762 | ||
| JSBACH-Princeton | [-] | 244. | -1.52 | 21.0 | 0.681 | 0.733 | 0.729 | 0.874 | 0.766 | ||
| Mean-CRUJRA | [-] | 235. | -14.4 | 27.8 | 0.876 | 0.682 | 0.760 | 0.882 | 0.771 | ||
| Mean-GSWP3 | [-] | 239. | -12.2 | 21.2 | 0.874 | 0.637 | 0.766 | 0.856 | 0.756 | ||
| Mean-Princeton | [-] | 243. | -8.39 | 20.9 | 0.729 | 0.656 | 0.754 | 0.892 | 0.764 |
Download Data |
Period Mean (original grids) [Watt m-2] |
Bias [Watt m-2] |
RMSE [Watt m-2] |
Phase Shift [months] |
Bias Score [1] |
RMSE Score [1] |
Seasonal Cycle Score [1] |
Overall Score [1] |
|||
|---|---|---|---|---|---|---|---|---|---|---|---|
| Benchmark | [-] | 151. | |||||||||
| CLM-CRUJRA | [-] | 173. | 17.8 | 25.1 | 0.471 | 0.725 | 0.803 | 0.946 | 0.819 | ||
| CLM-GSWP3 | [-] | 156. | 0.890 | 19.1 | 0.315 | 0.837 | 0.791 | 0.956 | 0.843 | ||
| CLM-Princeton | [-] | 157. | 1.27 | 15.9 | 0.236 | 0.847 | 0.824 | 0.961 | 0.864 | ||
| ISBA-CTRIP-CRUJRA | [-] | 169. | 17.4 | 25.0 | 0.510 | 0.732 | 0.801 | 0.945 | 0.819 | ||
| ISBA-CTRIP-GSWP3 | [-] | 153. | 1.88 | 19.6 | 0.292 | 0.832 | 0.790 | 0.959 | 0.843 | ||
| ISBA-CTRIP-Princeton | [-] | 154. | 2.39 | 17.2 | 0.292 | 0.841 | 0.816 | 0.959 | 0.858 | ||
| JSBACH-CRUJRA | [-] | 177. | 21.7 | 27.9 | 0.680 | 0.742 | 0.803 | 0.921 | 0.817 | ||
| JSBACH-GSWP3 | [-] | 160. | 4.67 | 18.4 | 0.341 | 0.923 | 0.795 | 0.944 | 0.864 | ||
| JSBACH-Princeton | [-] | 163. | 7.76 | 16.3 | 0.454 | 0.902 | 0.828 | 0.936 | 0.874 | ||
| Mean-CRUJRA | [-] | 169. | 17.8 | 25.4 | 0.437 | 0.728 | 0.799 | 0.949 | 0.819 | ||
| Mean-GSWP3 | [-] | 152. | 1.67 | 19.5 | 0.292 | 0.834 | 0.790 | 0.959 | 0.843 | ||
| Mean-Princeton | [-] | 152. | 1.57 | 16.6 | 0.219 | 0.845 | 0.823 | 0.964 | 0.863 |
Download Data |
Period Mean (original grids) [Watt m-2] |
Bias [Watt m-2] |
RMSE [Watt m-2] |
Phase Shift [months] |
Bias Score [1] |
RMSE Score [1] |
Seasonal Cycle Score [1] |
Overall Score [1] |
|||
|---|---|---|---|---|---|---|---|---|---|---|---|
| Benchmark | [-] | 214. | |||||||||
| CLM-CRUJRA | [-] | ||||||||||
| CLM-GSWP3 | [-] | ||||||||||
| CLM-Princeton | [-] | ||||||||||
| ISBA-CTRIP-CRUJRA | [-] | 208. | -6.14 | 26.0 | 0.00 | 0.806 | 0.412 | 1.00 | 0.657 | ||
| ISBA-CTRIP-GSWP3 | [-] | 222. | 8.01 | 26.0 | 1.02 | 0.755 | 0.421 | 0.933 | 0.632 | ||
| ISBA-CTRIP-Princeton | [-] | 210. | -4.23 | 19.1 | 1.02 | 0.862 | 0.525 | 0.933 | 0.711 | ||
| JSBACH-CRUJRA | [-] | ||||||||||
| JSBACH-GSWP3 | [-] | ||||||||||
| JSBACH-Princeton | [-] | ||||||||||
| Mean-CRUJRA | [-] | 208. | -6.14 | 26.0 | 0.00 | 0.806 | 0.412 | 1.00 | 0.657 | ||
| Mean-GSWP3 | [-] | 222. | 8.01 | 26.0 | 1.02 | 0.755 | 0.421 | 0.933 | 0.632 | ||
| Mean-Princeton | [-] | 210. | -4.23 | 19.1 | 1.02 | 0.862 | 0.525 | 0.933 | 0.711 |
Download Data |
Period Mean (original grids) [Watt m-2] |
Bias [Watt m-2] |
RMSE [Watt m-2] |
Phase Shift [months] |
Bias Score [1] |
RMSE Score [1] |
Seasonal Cycle Score [1] |
Overall Score [1] |
|||
|---|---|---|---|---|---|---|---|---|---|---|---|
| Benchmark | [-] | 213. | |||||||||
| CLM-CRUJRA | [-] | 216. | 6.27 | 28.2 | 1.02 | 0.693 | 0.493 | 0.873 | 0.638 | ||
| CLM-GSWP3 | [-] | 215. | 4.70 | 28.1 | 1.16 | 0.748 | 0.481 | 0.794 | 0.626 | ||
| CLM-Princeton | [-] | 209. | -0.573 | 24.3 | 1.88 | 0.836 | 0.515 | 0.705 | 0.643 | ||
| ISBA-CTRIP-CRUJRA | [-] | 215. | 5.44 | 28.0 | 1.02 | 0.706 | 0.493 | 0.873 | 0.641 | ||
| ISBA-CTRIP-GSWP3 | [-] | 219. | 5.97 | 26.8 | 0.860 | 0.748 | 0.538 | 0.851 | 0.669 | ||
| ISBA-CTRIP-Princeton | [-] | 211. | 0.995 | 23.4 | 1.73 | 0.810 | 0.517 | 0.714 | 0.639 | ||
| JSBACH-CRUJRA | [-] | 206. | 5.94 | 26.1 | 1.43 | 0.709 | 0.499 | 0.822 | 0.633 | ||
| JSBACH-GSWP3 | [-] | 202. | 1.37 | 24.0 | 1.63 | 0.805 | 0.492 | 0.712 | 0.625 | ||
| JSBACH-Princeton | [-] | 202. | 1.42 | 20.9 | 2.03 | 0.877 | 0.524 | 0.626 | 0.638 | ||
| Mean-CRUJRA | [-] | 217. | 7.03 | 28.6 | 1.02 | 0.694 | 0.493 | 0.873 | 0.638 | ||
| Mean-GSWP3 | [-] | 221. | 7.86 | 27.2 | 0.704 | 0.744 | 0.537 | 0.884 | 0.676 | ||
| Mean-Princeton | [-] | 212. | 1.64 | 23.5 | 1.59 | 0.814 | 0.514 | 0.724 | 0.642 |
Download Data |
Period Mean (original grids) [Watt m-2] |
Bias [Watt m-2] |
RMSE [Watt m-2] |
Phase Shift [months] |
Bias Score [1] |
RMSE Score [1] |
Seasonal Cycle Score [1] |
Overall Score [1] |
|||
|---|---|---|---|---|---|---|---|---|---|---|---|
| Benchmark | [-] | 121. | |||||||||
| CLM-CRUJRA | [-] | 98.7 | -22.0 | 37.2 | 1.02 | 0.672 | 0.388 | 0.903 | 0.588 | ||
| CLM-GSWP3 | [-] | 88.0 | -32.8 | 35.7 | 1.02 | 0.601 | 0.397 | 0.903 | 0.574 | ||
| CLM-Princeton | [-] | 81.7 | -39.1 | 35.1 | 1.02 | 0.548 | 0.389 | 0.903 | 0.557 | ||
| ISBA-CTRIP-CRUJRA | [-] | 98.0 | -22.7 | 37.1 | 1.02 | 0.670 | 0.387 | 0.903 | 0.586 | ||
| ISBA-CTRIP-GSWP3 | [-] | 86.4 | -34.3 | 32.2 | 1.02 | 0.581 | 0.401 | 0.903 | 0.572 | ||
| ISBA-CTRIP-Princeton | [-] | 80.1 | -40.6 | 36.3 | 1.02 | 0.524 | 0.384 | 0.903 | 0.549 | ||
| JSBACH-CRUJRA | [-] | 100. | 8.13 | 43.6 | 1.02 | 0.972 | 0.505 | 0.893 | 0.719 | ||
| JSBACH-GSWP3 | [-] | 85.0 | -7.08 | 38.1 | 1.02 | 0.873 | 0.523 | 0.893 | 0.703 | ||
| JSBACH-Princeton | [-] | 83.3 | -8.77 | 39.1 | 1.02 | 0.833 | 0.514 | 0.893 | 0.688 | ||
| Mean-CRUJRA | [-] | 99.1 | -21.7 | 37.7 | 1.02 | 0.669 | 0.387 | 0.903 | 0.587 | ||
| Mean-GSWP3 | [-] | 89.0 | -31.7 | 36.7 | 1.02 | 0.596 | 0.397 | 0.903 | 0.573 | ||
| Mean-Princeton | [-] | 82.1 | -38.6 | 35.7 | 1.02 | 0.547 | 0.388 | 0.903 | 0.556 |
Download Data |
Period Mean (original grids) [Watt m-2] |
Bias [Watt m-2] |
RMSE [Watt m-2] |
Phase Shift [months] |
Bias Score [1] |
RMSE Score [1] |
Seasonal Cycle Score [1] |
Overall Score [1] |
|||
|---|---|---|---|---|---|---|---|---|---|---|---|
| Benchmark | [-] | 169. | |||||||||
| CLM-CRUJRA | [-] | 174. | 4.33 | 27.0 | 0.203 | 0.814 | 0.801 | 0.987 | 0.850 | ||
| CLM-GSWP3 | [-] | 161. | -8.57 | 24.7 | 0.102 | 0.863 | 0.787 | 0.993 | 0.858 | ||
| CLM-Princeton | [-] | 161. | -8.09 | 22.4 | 0.102 | 0.868 | 0.807 | 0.993 | 0.869 | ||
| ISBA-CTRIP-CRUJRA | [-] | 174. | 4.14 | 27.7 | 0.203 | 0.805 | 0.795 | 0.987 | 0.846 | ||
| ISBA-CTRIP-GSWP3 | [-] | 161. | -8.41 | 24.9 | 0.102 | 0.863 | 0.789 | 0.993 | 0.858 | ||
| ISBA-CTRIP-Princeton | [-] | 161. | -7.99 | 22.5 | 0.102 | 0.863 | 0.810 | 0.993 | 0.869 | ||
| JSBACH-CRUJRA | [-] | 176. | 6.58 | 27.9 | 0.203 | 0.799 | 0.802 | 0.987 | 0.848 | ||
| JSBACH-GSWP3 | [-] | 161. | -7.99 | 24.6 | 0.102 | 0.862 | 0.785 | 0.993 | 0.856 | ||
| JSBACH-Princeton | [-] | 165. | -4.42 | 22.8 | 0.102 | 0.863 | 0.802 | 0.993 | 0.865 | ||
| Mean-CRUJRA | [-] | 175. | 5.17 | 28.0 | 0.305 | 0.802 | 0.799 | 0.980 | 0.845 | ||
| Mean-GSWP3 | [-] | 160. | -9.34 | 24.9 | 0.102 | 0.858 | 0.788 | 0.993 | 0.857 | ||
| Mean-Princeton | [-] | 162. | -7.87 | 22.6 | 0.102 | 0.864 | 0.808 | 0.993 | 0.868 |
Temporally integrated period mean