Mean State
Download Data |
Period Mean (original grids) [1] |
Model Period Mean (intersection) [1] |
Benchmark Period Mean (intersection) [1] |
Model Period Mean (complement) [1] |
Benchmark Period Mean (complement) [1] |
Bias [1] |
RMSE [1] |
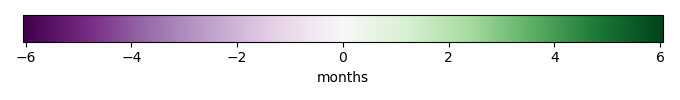
Phase Shift [months] |
Bias Score [1] |
RMSE Score [1] |
Seasonal Cycle Score [1] |
Spatial Distribution Score [1] |
Overall Score [1] |
|||
|---|---|---|---|---|---|---|---|---|---|---|---|---|---|---|---|---|
| Benchmark | [-] | 0.225 | ||||||||||||||
| CLM-CRUJRA | [-] | 0.213 | 0.214 | 0.226 | 0.166 | -0.0117 | 0.0712 | 0.921 | 0.752 | 0.680 | 0.904 | 0.970 | 0.797 | |||
| CLM-GSWP3 | [-] | 0.214 | 0.214 | 0.226 | 0.166 | -0.0120 | 0.0714 | 0.941 | 0.762 | 0.673 | 0.899 | 0.977 | 0.797 | |||
| CLM-Princeton | [-] | 0.201 | 0.202 | 0.226 | 0.167 | -0.0241 | 0.0744 | 0.917 | 0.736 | 0.666 | 0.907 | 0.985 | 0.792 | |||
| ISBA-CTRIP-CRUJRA | [-] | 0.234 | 0.233 | 0.226 | 0.130 | 0.00655 | 0.0935 | 0.897 | 0.730 | 0.635 | 0.909 | 0.926 | 0.767 | |||
| ISBA-CTRIP-GSWP3 | [-] | 0.224 | 0.223 | 0.226 | 0.130 | -0.00390 | 0.0864 | 0.917 | 0.748 | 0.630 | 0.907 | 0.953 | 0.773 | |||
| ISBA-CTRIP-Princeton | [-] | 0.214 | 0.213 | 0.225 | 0.130 | -0.0128 | 0.0865 | 0.920 | 0.734 | 0.636 | 0.907 | 0.968 | 0.776 | |||
| JSBACH-CRUJRA | [-] | 0.209 | 0.207 | 0.226 | 0.216 | -0.0185 | 0.110 | 0.986 | 0.721 | 0.541 | 0.889 | 0.974 | 0.733 | |||
| JSBACH-GSWP3 | [-] | 0.210 | 0.208 | 0.226 | 0.216 | -0.0180 | 0.0966 | 1.06 | 0.743 | 0.590 | 0.875 | 0.968 | 0.753 | |||
| JSBACH-Princeton | [-] | 0.191 | 0.189 | 0.226 | 0.216 | -0.0372 | 0.108 | 1.07 | 0.708 | 0.561 | 0.874 | 0.965 | 0.734 | |||
| Mean-CRUJRA | [-] | 0.222 | 0.220 | 0.226 | 0.0667 | -0.00570 | 0.0701 | 0.842 | 0.791 | 0.673 | 0.918 | 0.984 | 0.808 | |||
| Mean-GSWP3 | [-] | 0.219 | 0.217 | 0.226 | 0.0667 | -0.00895 | 0.0664 | 0.853 | 0.808 | 0.674 | 0.914 | 0.988 | 0.812 | |||
| Mean-Princeton | [-] | 0.205 | 0.203 | 0.225 | 0.0672 | -0.0221 | 0.0744 | 0.856 | 0.757 | 0.661 | 0.916 | 0.984 | 0.796 |
Download Data |
Period Mean (original grids) [1] |
Model Period Mean (intersection) [1] |
Benchmark Period Mean (intersection) [1] |
Model Period Mean (complement) [1] |
Benchmark Period Mean (complement) [1] |
Bias [1] |
RMSE [1] |
Phase Shift [months] |
Bias Score [1] |
RMSE Score [1] |
Seasonal Cycle Score [1] |
Spatial Distribution Score [1] |
Overall Score [1] |
|||
|---|---|---|---|---|---|---|---|---|---|---|---|---|---|---|---|---|
| Benchmark | [-] | 0.200 | ||||||||||||||
| CLM-CRUJRA | [-] | 0.212 | 0.212 | 0.205 | 0.101 | 0.00689 | 0.0480 | 2.23 | 0.515 | 0.503 | 0.645 | 0.987 | 0.630 | |||
| CLM-GSWP3 | [-] | 0.213 | 0.213 | 0.205 | 0.101 | 0.00778 | 0.0471 | 2.19 | 0.520 | 0.504 | 0.652 | 0.988 | 0.634 | |||
| CLM-Princeton | [-] | 0.209 | 0.209 | 0.206 | 0.101 | 0.00342 | 0.0504 | 2.29 | 0.497 | 0.503 | 0.637 | 0.973 | 0.623 | |||
| ISBA-CTRIP-CRUJRA | [-] | 0.217 | 0.217 | 0.202 | 0.0912 | 0.0146 | 0.0572 | 1.84 | 0.458 | 0.556 | 0.726 | 0.980 | 0.655 | |||
| ISBA-CTRIP-GSWP3 | [-] | 0.213 | 0.214 | 0.202 | 0.0912 | 0.0113 | 0.0548 | 1.84 | 0.466 | 0.560 | 0.725 | 0.980 | 0.658 | |||
| ISBA-CTRIP-Princeton | [-] | 0.209 | 0.209 | 0.202 | 0.0913 | 0.00688 | 0.0548 | 1.87 | 0.462 | 0.563 | 0.720 | 0.968 | 0.655 | |||
| JSBACH-CRUJRA | [-] | 0.215 | 0.215 | 0.213 | 0.128 | 0.00226 | 0.0613 | 2.24 | 0.458 | 0.534 | 0.650 | 0.979 | 0.631 | |||
| JSBACH-GSWP3 | [-] | 0.217 | 0.217 | 0.213 | 0.129 | 0.00460 | 0.0561 | 2.24 | 0.465 | 0.545 | 0.645 | 0.980 | 0.636 | |||
| JSBACH-Princeton | [-] | 0.208 | 0.209 | 0.213 | 0.129 | -0.00398 | 0.0608 | 2.28 | 0.465 | 0.532 | 0.639 | 0.974 | 0.628 | |||
| Mean-CRUJRA | [-] | 0.213 | 0.213 | 0.201 | 0.121 | 0.0120 | 0.0466 | 1.93 | 0.491 | 0.579 | 0.705 | 0.979 | 0.667 | |||
| Mean-GSWP3 | [-] | 0.213 | 0.213 | 0.201 | 0.121 | 0.0119 | 0.0449 | 1.91 | 0.496 | 0.581 | 0.707 | 0.979 | 0.669 | |||
| Mean-Princeton | [-] | 0.208 | 0.208 | 0.201 | 0.121 | 0.00636 | 0.0492 | 2.01 | 0.485 | 0.573 | 0.688 | 0.963 | 0.656 |
Download Data |
Period Mean (original grids) [1] |
Model Period Mean (intersection) [1] |
Benchmark Period Mean (intersection) [1] |
Model Period Mean (complement) [1] |
Benchmark Period Mean (complement) [1] |
Bias [1] |
RMSE [1] |
Phase Shift [months] |
Bias Score [1] |
RMSE Score [1] |
Seasonal Cycle Score [1] |
Spatial Distribution Score [1] |
Overall Score [1] |
|||
|---|---|---|---|---|---|---|---|---|---|---|---|---|---|---|---|---|
| Benchmark | [-] | 0.246 | ||||||||||||||
| CLM-CRUJRA | [-] | 0.259 | 0.259 | 0.249 | 0.0693 | 0.0102 | 0.0328 | 2.67 | 0.322 | 0.442 | 0.573 | 0.992 | 0.554 | |||
| CLM-GSWP3 | [-] | 0.261 | 0.262 | 0.249 | 0.0693 | 0.0127 | 0.0331 | 2.63 | 0.320 | 0.443 | 0.584 | 0.993 | 0.557 | |||
| CLM-Princeton | [-] | 0.263 | 0.263 | 0.249 | 0.0694 | 0.0135 | 0.0332 | 2.80 | 0.316 | 0.459 | 0.550 | 0.992 | 0.555 | |||
| ISBA-CTRIP-CRUJRA | [-] | 0.249 | 0.249 | 0.246 | 0.0685 | 0.00319 | 0.0439 | 2.49 | 0.239 | 0.577 | 0.612 | 0.928 | 0.587 | |||
| ISBA-CTRIP-GSWP3 | [-] | 0.249 | 0.249 | 0.246 | 0.0685 | 0.00313 | 0.0438 | 2.49 | 0.240 | 0.581 | 0.612 | 0.928 | 0.588 | |||
| ISBA-CTRIP-Princeton | [-] | 0.249 | 0.249 | 0.247 | 0.0685 | 0.00275 | 0.0439 | 2.51 | 0.239 | 0.577 | 0.606 | 0.927 | 0.585 | |||
| JSBACH-CRUJRA | [-] | 0.277 | 0.277 | 0.255 | 0.125 | 0.0229 | 0.0334 | 2.75 | 0.260 | 0.596 | 0.559 | 0.989 | 0.600 | |||
| JSBACH-GSWP3 | [-] | 0.277 | 0.277 | 0.255 | 0.125 | 0.0222 | 0.0332 | 2.79 | 0.265 | 0.587 | 0.549 | 0.988 | 0.595 | |||
| JSBACH-Princeton | [-] | 0.277 | 0.278 | 0.255 | 0.125 | 0.0231 | 0.0334 | 2.65 | 0.258 | 0.597 | 0.576 | 0.990 | 0.604 | |||
| Mean-CRUJRA | [-] | 0.260 | 0.260 | 0.245 | 0.242 | 0.0146 | 0.0301 | 2.45 | 0.327 | 0.583 | 0.615 | 0.968 | 0.615 | |||
| Mean-GSWP3 | [-] | 0.261 | 0.261 | 0.245 | 0.242 | 0.0152 | 0.0302 | 2.43 | 0.328 | 0.579 | 0.618 | 0.967 | 0.614 | |||
| Mean-Princeton | [-] | 0.262 | 0.261 | 0.246 | 0.243 | 0.0155 | 0.0303 | 2.54 | 0.324 | 0.584 | 0.592 | 0.968 | 0.610 |
Download Data |
Period Mean (original grids) [1] |
Model Period Mean (intersection) [1] |
Benchmark Period Mean (intersection) [1] |
Model Period Mean (complement) [1] |
Benchmark Period Mean (complement) [1] |
Bias [1] |
RMSE [1] |
Phase Shift [months] |
Bias Score [1] |
RMSE Score [1] |
Seasonal Cycle Score [1] |
Spatial Distribution Score [1] |
Overall Score [1] |
|||
|---|---|---|---|---|---|---|---|---|---|---|---|---|---|---|---|---|
| Benchmark | [-] | 0.209 | ||||||||||||||
| CLM-CRUJRA | [-] | 0.214 | 0.214 | 0.209 | 0.0668 | 0.00456 | 0.0437 | 1.26 | 0.594 | 0.531 | 0.815 | 0.993 | 0.693 | |||
| CLM-GSWP3 | [-] | 0.215 | 0.215 | 0.209 | 0.0668 | 0.00596 | 0.0379 | 1.29 | 0.590 | 0.568 | 0.803 | 0.992 | 0.704 | |||
| CLM-Princeton | [-] | 0.214 | 0.214 | 0.209 | 0.0670 | 0.00441 | 0.0417 | 1.38 | 0.601 | 0.545 | 0.791 | 0.994 | 0.695 | |||
| ISBA-CTRIP-CRUJRA | [-] | 0.233 | 0.236 | 0.209 | 0.0639 | 0.0271 | 0.0846 | 1.07 | 0.463 | 0.389 | 0.850 | 0.952 | 0.609 | |||
| ISBA-CTRIP-GSWP3 | [-] | 0.224 | 0.226 | 0.209 | 0.0639 | 0.0171 | 0.0706 | 1.05 | 0.499 | 0.428 | 0.848 | 0.988 | 0.638 | |||
| ISBA-CTRIP-Princeton | [-] | 0.218 | 0.220 | 0.209 | 0.0644 | 0.0111 | 0.0602 | 1.20 | 0.510 | 0.492 | 0.834 | 0.986 | 0.663 | |||
| JSBACH-CRUJRA | [-] | 0.215 | 0.215 | 0.211 | 0.148 | 0.00462 | 0.0511 | 1.24 | 0.572 | 0.554 | 0.820 | 0.991 | 0.698 | |||
| JSBACH-GSWP3 | [-] | 0.214 | 0.214 | 0.211 | 0.148 | 0.00393 | 0.0456 | 1.21 | 0.589 | 0.576 | 0.821 | 0.995 | 0.712 | |||
| JSBACH-Princeton | [-] | 0.214 | 0.214 | 0.211 | 0.148 | 0.00348 | 0.0488 | 1.32 | 0.574 | 0.561 | 0.800 | 0.992 | 0.697 | |||
| Mean-CRUJRA | [-] | 0.221 | 0.221 | 0.209 | 0.168 | 0.0123 | 0.0396 | 0.922 | 0.597 | 0.569 | 0.872 | 0.989 | 0.719 | |||
| Mean-GSWP3 | [-] | 0.218 | 0.218 | 0.209 | 0.168 | 0.00940 | 0.0340 | 0.930 | 0.613 | 0.613 | 0.866 | 0.971 | 0.735 | |||
| Mean-Princeton | [-] | 0.215 | 0.216 | 0.209 | 0.169 | 0.00671 | 0.0358 | 1.10 | 0.622 | 0.615 | 0.849 | 0.967 | 0.734 |
Download Data |
Period Mean (original grids) [1] |
Model Period Mean (intersection) [1] |
Benchmark Period Mean (intersection) [1] |
Model Period Mean (complement) [1] |
Benchmark Period Mean (complement) [1] |
Bias [1] |
RMSE [1] |
Phase Shift [months] |
Bias Score [1] |
RMSE Score [1] |
Seasonal Cycle Score [1] |
Spatial Distribution Score [1] |
Overall Score [1] |
|||
|---|---|---|---|---|---|---|---|---|---|---|---|---|---|---|---|---|
| Benchmark | [-] | 0.134 | ||||||||||||||
| CLM-CRUJRA | [-] | 0.164 | 0.151 | 0.143 | 0.0759 | 0.00870 | 0.0551 | 1.98 | 0.447 | 0.484 | 0.701 | 0.953 | 0.614 | |||
| CLM-GSWP3 | [-] | 0.167 | 0.152 | 0.143 | 0.0759 | 0.00996 | 0.0552 | 2.02 | 0.455 | 0.492 | 0.701 | 0.963 | 0.620 | |||
| CLM-Princeton | [-] | 0.161 | 0.149 | 0.143 | 0.0762 | 0.00576 | 0.0559 | 1.97 | 0.453 | 0.484 | 0.701 | 0.925 | 0.610 | |||
| ISBA-CTRIP-CRUJRA | [-] | 0.171 | 0.166 | 0.134 | 0.0611 | 0.0308 | 0.0642 | 2.42 | 0.384 | 0.452 | 0.621 | 0.949 | 0.572 | |||
| ISBA-CTRIP-GSWP3 | [-] | 0.180 | 0.172 | 0.134 | 0.0611 | 0.0367 | 0.0706 | 2.15 | 0.373 | 0.451 | 0.671 | 0.936 | 0.576 | |||
| ISBA-CTRIP-Princeton | [-] | 0.169 | 0.164 | 0.135 | 0.0611 | 0.0283 | 0.0624 | 2.22 | 0.388 | 0.464 | 0.658 | 0.954 | 0.586 | |||
| JSBACH-CRUJRA | [-] | 0.165 | 0.167 | 0.156 | 0.0881 | 0.0113 | 0.0637 | 1.93 | 0.407 | 0.481 | 0.713 | 0.882 | 0.593 | |||
| JSBACH-GSWP3 | [-] | 0.166 | 0.167 | 0.156 | 0.0881 | 0.0112 | 0.0622 | 2.15 | 0.417 | 0.502 | 0.674 | 0.873 | 0.594 | |||
| JSBACH-Princeton | [-] | 0.153 | 0.156 | 0.156 | 0.0881 | -2.02e-06 | 0.0632 | 2.35 | 0.433 | 0.490 | 0.631 | 0.827 | 0.574 | |||
| Mean-CRUJRA | [-] | 0.157 | 0.158 | 0.135 | 0.0611 | 0.0239 | 0.0531 | 1.95 | 0.406 | 0.498 | 0.710 | 0.919 | 0.606 | |||
| Mean-GSWP3 | [-] | 0.160 | 0.161 | 0.135 | 0.0611 | 0.0266 | 0.0539 | 1.90 | 0.402 | 0.504 | 0.716 | 0.940 | 0.613 | |||
| Mean-Princeton | [-] | 0.153 | 0.155 | 0.135 | 0.0611 | 0.0197 | 0.0520 | 1.93 | 0.417 | 0.502 | 0.719 | 0.861 | 0.600 |
Download Data |
Period Mean (original grids) [1] |
Model Period Mean (intersection) [1] |
Benchmark Period Mean (intersection) [1] |
Model Period Mean (complement) [1] |
Benchmark Period Mean (complement) [1] |
Bias [1] |
RMSE [1] |
Phase Shift [months] |
Bias Score [1] |
RMSE Score [1] |
Seasonal Cycle Score [1] |
Spatial Distribution Score [1] |
Overall Score [1] |
|||
|---|---|---|---|---|---|---|---|---|---|---|---|---|---|---|---|---|
| Benchmark | [-] | 0.151 | ||||||||||||||
| CLM-CRUJRA | [-] | 0.163 | 0.163 | 0.154 | 0.0711 | 0.00854 | 0.0451 | 1.53 | 0.634 | 0.529 | 0.763 | 0.965 | 0.684 | |||
| CLM-GSWP3 | [-] | 0.163 | 0.163 | 0.154 | 0.0711 | 0.00848 | 0.0451 | 1.58 | 0.642 | 0.530 | 0.756 | 0.967 | 0.685 | |||
| CLM-Princeton | [-] | 0.161 | 0.161 | 0.154 | 0.0712 | 0.00724 | 0.0436 | 1.57 | 0.633 | 0.545 | 0.760 | 0.954 | 0.687 | |||
| ISBA-CTRIP-CRUJRA | [-] | 0.167 | 0.168 | 0.152 | 0.0661 | 0.0153 | 0.0510 | 1.23 | 0.600 | 0.569 | 0.827 | 0.983 | 0.709 | |||
| ISBA-CTRIP-GSWP3 | [-] | 0.165 | 0.165 | 0.152 | 0.0661 | 0.0127 | 0.0488 | 1.35 | 0.609 | 0.576 | 0.810 | 0.982 | 0.710 | |||
| ISBA-CTRIP-Princeton | [-] | 0.163 | 0.164 | 0.152 | 0.0661 | 0.0116 | 0.0481 | 1.32 | 0.608 | 0.578 | 0.812 | 0.977 | 0.711 | |||
| JSBACH-CRUJRA | [-] | 0.161 | 0.161 | 0.161 | 0.0918 | 0.000461 | 0.0638 | 1.82 | 0.582 | 0.498 | 0.731 | 0.782 | 0.618 | |||
| JSBACH-GSWP3 | [-] | 0.164 | 0.164 | 0.161 | 0.0918 | 0.00338 | 0.0541 | 1.79 | 0.612 | 0.524 | 0.729 | 0.792 | 0.636 | |||
| JSBACH-Princeton | [-] | 0.155 | 0.155 | 0.161 | 0.0918 | -0.00526 | 0.0581 | 1.83 | 0.607 | 0.509 | 0.719 | 0.792 | 0.627 | |||
| Mean-CRUJRA | [-] | 0.164 | 0.164 | 0.152 | 0.0867 | 0.0112 | 0.0389 | 1.27 | 0.633 | 0.622 | 0.818 | 0.887 | 0.717 | |||
| Mean-GSWP3 | [-] | 0.164 | 0.163 | 0.152 | 0.0867 | 0.0109 | 0.0368 | 1.28 | 0.647 | 0.630 | 0.815 | 0.899 | 0.724 | |||
| Mean-Princeton | [-] | 0.160 | 0.160 | 0.152 | 0.0866 | 0.00787 | 0.0390 | 1.28 | 0.637 | 0.622 | 0.818 | 0.879 | 0.716 |
Download Data |
Period Mean (original grids) [1] |
Model Period Mean (intersection) [1] |
Benchmark Period Mean (intersection) [1] |
Model Period Mean (complement) [1] |
Benchmark Period Mean (complement) [1] |
Bias [1] |
RMSE [1] |
Phase Shift [months] |
Bias Score [1] |
RMSE Score [1] |
Seasonal Cycle Score [1] |
Spatial Distribution Score [1] |
Overall Score [1] |
|||
|---|---|---|---|---|---|---|---|---|---|---|---|---|---|---|---|---|
| Benchmark | [-] | 0.116 | ||||||||||||||
| CLM-CRUJRA | [-] | 0.136 | 0.136 | 0.120 | 0.0615 | 0.0160 | 0.0208 | 3.46 | 0.438 | 0.538 | 0.425 | 0.0728 | 0.402 | |||
| CLM-GSWP3 | [-] | 0.135 | 0.135 | 0.120 | 0.0615 | 0.0149 | 0.0202 | 3.44 | 0.465 | 0.539 | 0.429 | 0.0900 | 0.412 | |||
| CLM-Princeton | [-] | 0.139 | 0.139 | 0.121 | 0.0616 | 0.0182 | 0.0223 | 3.56 | 0.396 | 0.531 | 0.404 | 0.0729 | 0.387 | |||
| ISBA-CTRIP-CRUJRA | [-] | 0.141 | 0.141 | 0.117 | 0.0567 | 0.0242 | 0.0273 | 3.11 | 0.355 | 0.552 | 0.485 | 0.519 | 0.493 | |||
| ISBA-CTRIP-GSWP3 | [-] | 0.140 | 0.141 | 0.117 | 0.0567 | 0.0239 | 0.0271 | 3.11 | 0.358 | 0.550 | 0.487 | 0.511 | 0.491 | |||
| ISBA-CTRIP-Princeton | [-] | 0.140 | 0.141 | 0.117 | 0.0567 | 0.0236 | 0.0270 | 3.10 | 0.370 | 0.544 | 0.487 | 0.510 | 0.491 | |||
| JSBACH-CRUJRA | [-] | 0.142 | 0.140 | 0.125 | 0.0860 | 0.0149 | 0.0204 | 3.29 | 0.485 | 0.557 | 0.445 | 0.986 | 0.606 | |||
| JSBACH-GSWP3 | [-] | 0.144 | 0.142 | 0.125 | 0.0860 | 0.0169 | 0.0210 | 3.40 | 0.460 | 0.553 | 0.425 | 0.978 | 0.594 | |||
| JSBACH-Princeton | [-] | 0.139 | 0.137 | 0.125 | 0.0860 | 0.0118 | 0.0193 | 3.50 | 0.496 | 0.540 | 0.403 | 0.971 | 0.590 | |||
| Mean-CRUJRA | [-] | 0.140 | 0.140 | 0.117 | 0.0531 | 0.0227 | 0.0261 | 2.91 | 0.397 | 0.550 | 0.511 | 0.413 | 0.484 | |||
| Mean-GSWP3 | [-] | 0.139 | 0.140 | 0.117 | 0.0531 | 0.0227 | 0.0260 | 2.97 | 0.393 | 0.548 | 0.500 | 0.401 | 0.478 | |||
| Mean-Princeton | [-] | 0.139 | 0.140 | 0.117 | 0.0530 | 0.0225 | 0.0262 | 3.25 | 0.405 | 0.539 | 0.451 | 0.388 | 0.464 |
Download Data |
Period Mean (original grids) [1] |
Model Period Mean (intersection) [1] |
Benchmark Period Mean (intersection) [1] |
Model Period Mean (complement) [1] |
Benchmark Period Mean (complement) [1] |
Bias [1] |
RMSE [1] |
Phase Shift [months] |
Bias Score [1] |
RMSE Score [1] |
Seasonal Cycle Score [1] |
Spatial Distribution Score [1] |
Overall Score [1] |
|||
|---|---|---|---|---|---|---|---|---|---|---|---|---|---|---|---|---|
| Benchmark | [-] | 0.125 | ||||||||||||||
| CLM-CRUJRA | [-] | 0.143 | 0.143 | 0.128 | 0.0593 | 0.0144 | 0.0249 | 3.85 | 0.432 | 0.383 | 0.341 | 0.676 | 0.443 | |||
| CLM-GSWP3 | [-] | 0.142 | 0.142 | 0.128 | 0.0593 | 0.0140 | 0.0252 | 3.72 | 0.440 | 0.372 | 0.364 | 0.735 | 0.457 | |||
| CLM-Princeton | [-] | 0.146 | 0.146 | 0.128 | 0.0594 | 0.0174 | 0.0264 | 3.80 | 0.399 | 0.379 | 0.350 | 0.680 | 0.438 | |||
| ISBA-CTRIP-CRUJRA | [-] | 0.145 | 0.145 | 0.126 | 0.0560 | 0.0186 | 0.0251 | 2.03 | 0.377 | 0.543 | 0.694 | 0.601 | 0.552 | |||
| ISBA-CTRIP-GSWP3 | [-] | 0.144 | 0.144 | 0.126 | 0.0560 | 0.0183 | 0.0249 | 2.04 | 0.382 | 0.542 | 0.692 | 0.601 | 0.552 | |||
| ISBA-CTRIP-Princeton | [-] | 0.144 | 0.144 | 0.126 | 0.0560 | 0.0182 | 0.0249 | 2.03 | 0.385 | 0.541 | 0.695 | 0.603 | 0.553 | |||
| JSBACH-CRUJRA | [-] | 0.158 | 0.158 | 0.133 | 0.0819 | 0.0251 | 0.0305 | 3.39 | 0.299 | 0.469 | 0.435 | 0.979 | 0.530 | |||
| JSBACH-GSWP3 | [-] | 0.159 | 0.160 | 0.133 | 0.0819 | 0.0270 | 0.0314 | 3.33 | 0.273 | 0.467 | 0.442 | 0.991 | 0.528 | |||
| JSBACH-Princeton | [-] | 0.154 | 0.154 | 0.133 | 0.0819 | 0.0213 | 0.0280 | 3.47 | 0.343 | 0.449 | 0.410 | 0.984 | 0.527 | |||
| Mean-CRUJRA | [-] | 0.148 | 0.148 | 0.126 | 0.0628 | 0.0218 | 0.0268 | 2.86 | 0.356 | 0.491 | 0.536 | 0.629 | 0.501 | |||
| Mean-GSWP3 | [-] | 0.148 | 0.148 | 0.126 | 0.0628 | 0.0221 | 0.0270 | 2.85 | 0.350 | 0.486 | 0.534 | 0.635 | 0.498 | |||
| Mean-Princeton | [-] | 0.147 | 0.147 | 0.126 | 0.0628 | 0.0215 | 0.0268 | 2.98 | 0.361 | 0.484 | 0.509 | 0.621 | 0.492 |
Download Data |
Period Mean (original grids) [1] |
Model Period Mean (intersection) [1] |
Benchmark Period Mean (intersection) [1] |
Model Period Mean (complement) [1] |
Benchmark Period Mean (complement) [1] |
Bias [1] |
RMSE [1] |
Phase Shift [months] |
Bias Score [1] |
RMSE Score [1] |
Seasonal Cycle Score [1] |
Spatial Distribution Score [1] |
Overall Score [1] |
|||
|---|---|---|---|---|---|---|---|---|---|---|---|---|---|---|---|---|
| Benchmark | [-] | 0.425 | ||||||||||||||
| CLM-CRUJRA | [-] | 0.394 | 0.392 | 0.423 | 0.492 | -0.0315 | 0.102 | 0.851 | 0.746 | 0.692 | 0.905 | 0.955 | 0.798 | |||
| CLM-GSWP3 | [-] | 0.400 | 0.399 | 0.423 | 0.492 | -0.0246 | 0.101 | 0.728 | 0.750 | 0.689 | 0.919 | 0.973 | 0.804 | |||
| CLM-Princeton | [-] | 0.362 | 0.361 | 0.424 | 0.493 | -0.0633 | 0.119 | 0.980 | 0.695 | 0.655 | 0.887 | 0.973 | 0.773 | |||
| ISBA-CTRIP-CRUJRA | [-] | 0.411 | 0.409 | 0.425 | 0.493 | -0.0166 | 0.0927 | 1.47 | 0.761 | 0.696 | 0.807 | 0.979 | 0.788 | |||
| ISBA-CTRIP-GSWP3 | [-] | 0.405 | 0.404 | 0.425 | 0.493 | -0.0215 | 0.0974 | 1.32 | 0.760 | 0.673 | 0.823 | 0.981 | 0.782 | |||
| ISBA-CTRIP-Princeton | [-] | 0.381 | 0.380 | 0.425 | 0.495 | -0.0458 | 0.105 | 1.42 | 0.718 | 0.659 | 0.801 | 0.976 | 0.762 | |||
| JSBACH-CRUJRA | [-] | 0.352 | 0.353 | 0.417 | 0.497 | -0.0650 | 0.134 | 1.12 | 0.669 | 0.609 | 0.862 | 0.930 | 0.736 | |||
| JSBACH-GSWP3 | [-] | 0.361 | 0.361 | 0.417 | 0.497 | -0.0564 | 0.118 | 0.969 | 0.704 | 0.634 | 0.883 | 0.952 | 0.762 | |||
| JSBACH-Princeton | [-] | 0.331 | 0.331 | 0.417 | 0.497 | -0.0866 | 0.146 | 1.19 | 0.624 | 0.594 | 0.860 | 0.933 | 0.721 | |||
| Mean-CRUJRA | [-] | 0.390 | 0.388 | 0.425 | 0.527 | -0.0369 | 0.0913 | 0.940 | 0.745 | 0.713 | 0.900 | 0.963 | 0.807 | |||
| Mean-GSWP3 | [-] | 0.394 | 0.391 | 0.425 | 0.527 | -0.0334 | 0.0883 | 0.799 | 0.763 | 0.709 | 0.914 | 0.974 | 0.814 | |||
| Mean-Princeton | [-] | 0.362 | 0.360 | 0.425 | 0.528 | -0.0648 | 0.111 | 0.981 | 0.691 | 0.673 | 0.893 | 0.968 | 0.779 |
Download Data |
Period Mean (original grids) [1] |
Model Period Mean (intersection) [1] |
Benchmark Period Mean (intersection) [1] |
Model Period Mean (complement) [1] |
Benchmark Period Mean (complement) [1] |
Bias [1] |
RMSE [1] |
Phase Shift [months] |
Bias Score [1] |
RMSE Score [1] |
Seasonal Cycle Score [1] |
Spatial Distribution Score [1] |
Overall Score [1] |
|||
|---|---|---|---|---|---|---|---|---|---|---|---|---|---|---|---|---|
| Benchmark | [-] | 0.175 | ||||||||||||||
| CLM-CRUJRA | [-] | 0.188 | 0.188 | 0.177 | 0.0630 | 0.0104 | 0.0475 | 1.40 | 0.627 | 0.529 | 0.791 | 0.979 | 0.691 | |||
| CLM-GSWP3 | [-] | 0.184 | 0.184 | 0.177 | 0.0630 | 0.00663 | 0.0430 | 1.37 | 0.638 | 0.545 | 0.795 | 0.932 | 0.691 | |||
| CLM-Princeton | [-] | 0.185 | 0.185 | 0.177 | 0.0630 | 0.00782 | 0.0478 | 1.46 | 0.625 | 0.532 | 0.781 | 0.937 | 0.681 | |||
| ISBA-CTRIP-CRUJRA | [-] | 0.199 | 0.199 | 0.176 | 0.0583 | 0.0232 | 0.0590 | 1.35 | 0.576 | 0.530 | 0.802 | 0.978 | 0.683 | |||
| ISBA-CTRIP-GSWP3 | [-] | 0.191 | 0.192 | 0.176 | 0.0583 | 0.0161 | 0.0502 | 1.41 | 0.593 | 0.557 | 0.791 | 0.986 | 0.697 | |||
| ISBA-CTRIP-Princeton | [-] | 0.189 | 0.189 | 0.176 | 0.0582 | 0.0129 | 0.0479 | 1.45 | 0.595 | 0.566 | 0.788 | 0.981 | 0.699 | |||
| JSBACH-CRUJRA | [-] | 0.170 | 0.170 | 0.183 | 0.0888 | -0.0125 | 0.0711 | 1.77 | 0.585 | 0.507 | 0.734 | 0.903 | 0.647 | |||
| JSBACH-GSWP3 | [-] | 0.174 | 0.175 | 0.183 | 0.0888 | -0.00774 | 0.0641 | 1.90 | 0.601 | 0.520 | 0.707 | 0.847 | 0.639 | |||
| JSBACH-Princeton | [-] | 0.167 | 0.168 | 0.183 | 0.0888 | -0.0150 | 0.0699 | 1.84 | 0.586 | 0.513 | 0.716 | 0.860 | 0.637 | |||
| Mean-CRUJRA | [-] | 0.185 | 0.185 | 0.176 | 0.118 | 0.00898 | 0.0388 | 1.29 | 0.636 | 0.635 | 0.812 | 0.949 | 0.733 | |||
| Mean-GSWP3 | [-] | 0.183 | 0.183 | 0.176 | 0.118 | 0.00689 | 0.0359 | 1.27 | 0.636 | 0.642 | 0.817 | 0.879 | 0.723 | |||
| Mean-Princeton | [-] | 0.180 | 0.180 | 0.176 | 0.118 | 0.00401 | 0.0421 | 1.37 | 0.636 | 0.620 | 0.799 | 0.871 | 0.709 |
Temporally integrated period mean