Mean State
Download Data |
Period Mean (original grids) [W m-2] |
Model Period Mean (intersection) [W m-2] |
Benchmark Period Mean (intersection) [W m-2] |
Model Period Mean (complement) [W m-2] |
Benchmark Period Mean (complement) [W m-2] |
Bias [W m-2] |
RMSE [W m-2] |
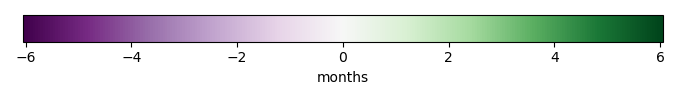
Phase Shift [months] |
Bias Score [1] |
RMSE Score [1] |
Seasonal Cycle Score [1] |
Spatial Distribution Score [1] |
Overall Score [1] |
|||
|---|---|---|---|---|---|---|---|---|---|---|---|---|---|---|---|---|
| Benchmark | [-] | -49.3 | ||||||||||||||
| CLM-CRUJRA | [-] | -57.4 | -57.5 | -49.5 | -43.8 | -7.96 | 14.6 | 1.49 | 0.495 | 0.410 | 0.796 | 0.994 | 0.621 | |||
| CLM-GSWP3 | [-] | -54.1 | -54.4 | -49.5 | -43.8 | -4.90 | 14.7 | 1.90 | 0.548 | 0.366 | 0.737 | 0.966 | 0.597 | |||
| CLM-Princeton | [-] | -54.1 | -54.3 | -49.4 | -43.9 | -4.87 | 13.6 | 1.59 | 0.575 | 0.398 | 0.794 | 0.984 | 0.630 | |||
| ISBA-CTRIP-CRUJRA | [-] | -51.0 | -51.4 | -49.4 | -42.9 | -1.97 | 12.8 | 1.56 | 0.604 | 0.423 | 0.786 | 0.955 | 0.638 | |||
| ISBA-CTRIP-GSWP3 | [-] | -47.3 | -47.7 | -49.4 | -42.9 | 1.64 | 13.7 | 1.97 | 0.629 | 0.382 | 0.720 | 0.891 | 0.601 | |||
| ISBA-CTRIP-Princeton | [-] | -48.4 | -48.7 | -49.3 | -42.8 | 0.630 | 12.8 | 1.61 | 0.656 | 0.393 | 0.786 | 0.994 | 0.644 | |||
| Mean-CRUJRA | [-] | -53.9 | -54.1 | -49.4 | -43.0 | -4.67 | 12.8 | 1.55 | 0.565 | 0.439 | 0.792 | 0.984 | 0.644 | |||
| Mean-GSWP3 | [-] | -50.7 | -50.8 | -49.4 | -43.0 | -1.41 | 13.4 | 1.94 | 0.614 | 0.385 | 0.727 | 0.928 | 0.608 | |||
| Mean-Princeton | [-] | -50.8 | -51.1 | -49.3 | -43.0 | -1.73 | 12.7 | 1.63 | 0.639 | 0.401 | 0.786 | 0.993 | 0.644 |
Download Data |
Period Mean (original grids) [W m-2] |
Model Period Mean (intersection) [W m-2] |
Benchmark Period Mean (intersection) [W m-2] |
Model Period Mean (complement) [W m-2] |
Benchmark Period Mean (complement) [W m-2] |
Bias [W m-2] |
RMSE [W m-2] |
Phase Shift [months] |
Bias Score [1] |
RMSE Score [1] |
Seasonal Cycle Score [1] |
Spatial Distribution Score [1] |
Overall Score [1] |
|||
|---|---|---|---|---|---|---|---|---|---|---|---|---|---|---|---|---|
| Benchmark | [-] | -63.4 | ||||||||||||||
| CLM-CRUJRA | [-] | -77.2 | -74.8 | -63.8 | -54.6 | -11.0 | 17.3 | 1.46 | 0.462 | 0.472 | 0.786 | 0.989 | 0.636 | |||
| CLM-GSWP3 | [-] | -75.1 | -72.8 | -63.8 | -54.6 | -8.97 | 17.8 | 1.47 | 0.492 | 0.443 | 0.791 | 0.989 | 0.632 | |||
| CLM-Princeton | [-] | -76.1 | -73.1 | -63.9 | -54.6 | -9.28 | 16.7 | 1.36 | 0.484 | 0.488 | 0.808 | 0.979 | 0.649 | |||
| ISBA-CTRIP-CRUJRA | [-] | -66.1 | -66.2 | -63.6 | -52.8 | -2.61 | 13.8 | 1.41 | 0.570 | 0.494 | 0.795 | 0.966 | 0.664 | |||
| ISBA-CTRIP-GSWP3 | [-] | -63.0 | -63.1 | -63.6 | -52.8 | 0.490 | 15.3 | 1.49 | 0.550 | 0.458 | 0.787 | 0.970 | 0.645 | |||
| ISBA-CTRIP-Princeton | [-] | -64.8 | -64.9 | -63.6 | -52.8 | -1.31 | 14.1 | 1.39 | 0.565 | 0.487 | 0.804 | 0.989 | 0.666 | |||
| Mean-CRUJRA | [-] | -69.9 | -69.9 | -63.4 | -59.6 | -6.51 | 14.7 | 1.43 | 0.529 | 0.500 | 0.791 | 0.981 | 0.660 | |||
| Mean-GSWP3 | [-] | -67.4 | -67.4 | -63.4 | -59.6 | -3.95 | 15.4 | 1.48 | 0.545 | 0.463 | 0.788 | 0.984 | 0.649 | |||
| Mean-Princeton | [-] | -68.4 | -68.4 | -63.4 | -59.6 | -5.00 | 14.7 | 1.39 | 0.538 | 0.493 | 0.803 | 0.986 | 0.663 |
Download Data |
Period Mean (original grids) [W m-2] |
Model Period Mean (intersection) [W m-2] |
Benchmark Period Mean (intersection) [W m-2] |
Model Period Mean (complement) [W m-2] |
Benchmark Period Mean (complement) [W m-2] |
Bias [W m-2] |
RMSE [W m-2] |
Phase Shift [months] |
Bias Score [1] |
RMSE Score [1] |
Seasonal Cycle Score [1] |
Spatial Distribution Score [1] |
Overall Score [1] |
|||
|---|---|---|---|---|---|---|---|---|---|---|---|---|---|---|---|---|
| Benchmark | [-] | -100. | ||||||||||||||
| CLM-CRUJRA | [-] | -107. | -107. | -101. | -63.7 | -6.63 | 16.0 | 1.01 | 0.625 | 0.535 | 0.852 | 0.860 | 0.681 | |||
| CLM-GSWP3 | [-] | -107. | -107. | -101. | -63.7 | -6.63 | 16.5 | 0.957 | 0.611 | 0.524 | 0.866 | 0.884 | 0.682 | |||
| CLM-Princeton | [-] | -109. | -109. | -101. | -63.8 | -8.66 | 15.1 | 0.811 | 0.608 | 0.589 | 0.882 | 0.859 | 0.705 | |||
| ISBA-CTRIP-CRUJRA | [-] | -95.8 | -96.0 | -100. | -62.6 | 4.40 | 14.5 | 0.883 | 0.623 | 0.562 | 0.872 | 0.853 | 0.694 | |||
| ISBA-CTRIP-GSWP3 | [-] | -94.1 | -94.0 | -100. | -62.6 | 6.43 | 16.2 | 0.952 | 0.585 | 0.536 | 0.864 | 0.873 | 0.679 | |||
| ISBA-CTRIP-Princeton | [-] | -97.6 | -97.7 | -100. | -62.6 | 2.72 | 13.8 | 0.860 | 0.634 | 0.583 | 0.875 | 0.824 | 0.700 | |||
| Mean-CRUJRA | [-] | -101. | -101. | -100. | -89.0 | -0.923 | 14.0 | 0.908 | 0.659 | 0.562 | 0.868 | 0.850 | 0.700 | |||
| Mean-GSWP3 | [-] | -100. | -100. | -100. | -89.0 | 0.0446 | 14.7 | 0.920 | 0.647 | 0.544 | 0.869 | 0.870 | 0.695 | |||
| Mean-Princeton | [-] | -103. | -103. | -100. | -89.0 | -2.85 | 13.2 | 0.833 | 0.660 | 0.594 | 0.878 | 0.827 | 0.711 |
Download Data |
Period Mean (original grids) [W m-2] |
Model Period Mean (intersection) [W m-2] |
Benchmark Period Mean (intersection) [W m-2] |
Model Period Mean (complement) [W m-2] |
Benchmark Period Mean (complement) [W m-2] |
Bias [W m-2] |
RMSE [W m-2] |
Phase Shift [months] |
Bias Score [1] |
RMSE Score [1] |
Seasonal Cycle Score [1] |
Spatial Distribution Score [1] |
Overall Score [1] |
|||
|---|---|---|---|---|---|---|---|---|---|---|---|---|---|---|---|---|
| Benchmark | [-] | -89.5 | ||||||||||||||
| CLM-CRUJRA | [-] | -97.3 | -96.4 | -89.5 | -66.2 | -6.68 | 15.9 | 0.672 | 0.646 | 0.626 | 0.934 | 0.951 | 0.757 | |||
| CLM-GSWP3 | [-] | -91.2 | -90.4 | -89.5 | -66.2 | -0.497 | 16.6 | 0.684 | 0.678 | 0.572 | 0.931 | 0.982 | 0.747 | |||
| CLM-Princeton | [-] | -97.0 | -96.2 | -89.6 | -66.0 | -6.27 | 14.8 | 0.542 | 0.666 | 0.643 | 0.946 | 0.988 | 0.777 | |||
| ISBA-CTRIP-CRUJRA | [-] | -85.1 | -85.0 | -89.6 | -60.8 | 4.45 | 14.1 | 0.691 | 0.696 | 0.646 | 0.930 | 0.891 | 0.762 | |||
| ISBA-CTRIP-GSWP3 | [-] | -79.4 | -79.2 | -89.6 | -60.8 | 10.3 | 18.2 | 0.673 | 0.603 | 0.597 | 0.930 | 0.939 | 0.733 | |||
| ISBA-CTRIP-Princeton | [-] | -86.4 | -86.0 | -89.5 | -60.7 | 3.39 | 13.7 | 0.619 | 0.713 | 0.644 | 0.939 | 0.954 | 0.779 | |||
| Mean-CRUJRA | [-] | -90.5 | -90.4 | -89.6 | -76.6 | -0.828 | 13.6 | 0.635 | 0.704 | 0.663 | 0.940 | 0.898 | 0.774 | |||
| Mean-GSWP3 | [-] | -84.5 | -84.4 | -89.6 | -76.6 | 5.14 | 16.2 | 0.603 | 0.672 | 0.603 | 0.940 | 0.948 | 0.753 | |||
| Mean-Princeton | [-] | -90.6 | -90.6 | -89.5 | -76.6 | -1.10 | 13.3 | 0.569 | 0.715 | 0.656 | 0.944 | 0.966 | 0.788 |
Download Data |
Period Mean (original grids) [W m-2] |
Model Period Mean (intersection) [W m-2] |
Benchmark Period Mean (intersection) [W m-2] |
Model Period Mean (complement) [W m-2] |
Benchmark Period Mean (complement) [W m-2] |
Bias [W m-2] |
RMSE [W m-2] |
Phase Shift [months] |
Bias Score [1] |
RMSE Score [1] |
Seasonal Cycle Score [1] |
Spatial Distribution Score [1] |
Overall Score [1] |
|||
|---|---|---|---|---|---|---|---|---|---|---|---|---|---|---|---|---|
| Benchmark | [-] | -49.7 | ||||||||||||||
| CLM-CRUJRA | [-] | -48.8 | -52.3 | -49.6 | -49.8 | -3.47 | 15.2 | 2.45 | 0.471 | 0.317 | 0.622 | 0.964 | 0.538 | |||
| CLM-GSWP3 | [-] | -45.4 | -50.0 | -49.6 | -49.8 | -1.15 | 16.7 | 2.56 | 0.400 | 0.331 | 0.593 | 0.966 | 0.524 | |||
| CLM-Princeton | [-] | -46.2 | -49.7 | -49.6 | -50.1 | -0.825 | 14.4 | 2.63 | 0.471 | 0.337 | 0.603 | 0.975 | 0.544 | |||
| ISBA-CTRIP-CRUJRA | [-] | -48.5 | -48.4 | -49.7 | -48.2 | 1.61 | 14.7 | 2.55 | 0.435 | 0.335 | 0.596 | 0.982 | 0.536 | |||
| ISBA-CTRIP-GSWP3 | [-] | -45.2 | -44.4 | -49.7 | -48.2 | 5.50 | 16.3 | 2.72 | 0.401 | 0.339 | 0.555 | 0.978 | 0.522 | |||
| ISBA-CTRIP-Princeton | [-] | -44.5 | -44.5 | -49.7 | -48.5 | 5.28 | 14.8 | 2.68 | 0.419 | 0.333 | 0.586 | 0.982 | 0.531 | |||
| Mean-CRUJRA | [-] | -48.9 | -48.6 | -49.7 | -47.8 | 1.06 | 14.2 | 2.54 | 0.469 | 0.347 | 0.600 | 0.983 | 0.549 | |||
| Mean-GSWP3 | [-] | -45.9 | -46.3 | -49.7 | -47.8 | 3.42 | 15.0 | 2.57 | 0.458 | 0.351 | 0.591 | 0.982 | 0.547 | |||
| Mean-Princeton | [-] | -45.6 | -46.0 | -49.7 | -48.1 | 3.67 | 14.0 | 2.62 | 0.445 | 0.343 | 0.597 | 0.986 | 0.543 |
Download Data |
Period Mean (original grids) [W m-2] |
Model Period Mean (intersection) [W m-2] |
Benchmark Period Mean (intersection) [W m-2] |
Model Period Mean (complement) [W m-2] |
Benchmark Period Mean (complement) [W m-2] |
Bias [W m-2] |
RMSE [W m-2] |
Phase Shift [months] |
Bias Score [1] |
RMSE Score [1] |
Seasonal Cycle Score [1] |
Spatial Distribution Score [1] |
Overall Score [1] |
|||
|---|---|---|---|---|---|---|---|---|---|---|---|---|---|---|---|---|
| Benchmark | [-] | -50.0 | ||||||||||||||
| CLM-CRUJRA | [-] | -61.7 | -61.6 | -49.9 | -50.2 | -11.7 | 16.9 | 1.55 | 0.380 | 0.444 | 0.770 | 0.992 | 0.606 | |||
| CLM-GSWP3 | [-] | -58.1 | -58.2 | -49.9 | -50.2 | -8.44 | 15.9 | 1.95 | 0.439 | 0.413 | 0.707 | 0.953 | 0.585 | |||
| CLM-Princeton | [-] | -58.7 | -58.7 | -50.0 | -50.4 | -8.73 | 14.1 | 1.67 | 0.455 | 0.483 | 0.756 | 0.993 | 0.634 | |||
| ISBA-CTRIP-CRUJRA | [-] | -55.1 | -55.2 | -49.9 | -47.2 | -5.33 | 12.6 | 1.60 | 0.540 | 0.477 | 0.759 | 0.946 | 0.640 | |||
| ISBA-CTRIP-GSWP3 | [-] | -51.2 | -51.4 | -49.9 | -47.2 | -1.57 | 13.1 | 1.98 | 0.590 | 0.435 | 0.702 | 0.906 | 0.614 | |||
| ISBA-CTRIP-Princeton | [-] | -52.3 | -52.5 | -50.0 | -47.4 | -2.55 | 11.1 | 1.67 | 0.618 | 0.491 | 0.758 | 0.980 | 0.668 | |||
| Mean-CRUJRA | [-] | -58.0 | -58.0 | -49.9 | -47.6 | -8.08 | 14.0 | 1.57 | 0.462 | 0.484 | 0.765 | 0.963 | 0.632 | |||
| Mean-GSWP3 | [-] | -54.5 | -54.5 | -49.9 | -47.6 | -4.53 | 13.7 | 1.97 | 0.526 | 0.442 | 0.704 | 0.900 | 0.603 | |||
| Mean-Princeton | [-] | -55.1 | -55.2 | -50.0 | -47.8 | -5.18 | 12.0 | 1.67 | 0.546 | 0.498 | 0.757 | 0.978 | 0.656 |
Download Data |
Period Mean (original grids) [W m-2] |
Model Period Mean (intersection) [W m-2] |
Benchmark Period Mean (intersection) [W m-2] |
Model Period Mean (complement) [W m-2] |
Benchmark Period Mean (complement) [W m-2] |
Bias [W m-2] |
RMSE [W m-2] |
Phase Shift [months] |
Bias Score [1] |
RMSE Score [1] |
Seasonal Cycle Score [1] |
Spatial Distribution Score [1] |
Overall Score [1] |
|||
|---|---|---|---|---|---|---|---|---|---|---|---|---|---|---|---|---|
| Benchmark | [-] | -35.2 | ||||||||||||||
| CLM-CRUJRA | [-] | -46.7 | -46.3 | -34.4 | -46.8 | -12.1 | 15.4 | 1.89 | 0.181 | 0.365 | 0.717 | 0.906 | 0.507 | |||
| CLM-GSWP3 | [-] | -47.8 | -47.3 | -34.4 | -46.8 | -13.0 | 17.3 | 1.82 | 0.159 | 0.315 | 0.741 | 0.908 | 0.488 | |||
| CLM-Princeton | [-] | -48.1 | -47.5 | -34.2 | -46.7 | -13.4 | 16.9 | 1.90 | 0.163 | 0.342 | 0.722 | 0.865 | 0.487 | |||
| ISBA-CTRIP-CRUJRA | [-] | -42.4 | -42.7 | -35.1 | -46.3 | -7.60 | 13.6 | 1.90 | 0.242 | 0.371 | 0.718 | 0.844 | 0.509 | |||
| ISBA-CTRIP-GSWP3 | [-] | -40.7 | -41.1 | -35.1 | -46.3 | -5.94 | 14.3 | 1.75 | 0.227 | 0.333 | 0.747 | 0.917 | 0.511 | |||
| ISBA-CTRIP-Princeton | [-] | -41.9 | -42.2 | -35.0 | -46.2 | -7.21 | 14.6 | 1.93 | 0.219 | 0.337 | 0.715 | 0.897 | 0.501 | |||
| Mean-CRUJRA | [-] | -44.3 | -44.2 | -35.1 | -45.9 | -9.11 | 14.3 | 1.89 | 0.212 | 0.381 | 0.723 | 0.862 | 0.512 | |||
| Mean-GSWP3 | [-] | -43.8 | -43.7 | -35.1 | -45.9 | -8.63 | 15.3 | 1.69 | 0.191 | 0.339 | 0.761 | 0.879 | 0.502 | |||
| Mean-Princeton | [-] | -44.3 | -44.3 | -35.0 | -45.8 | -9.35 | 15.4 | 1.92 | 0.192 | 0.345 | 0.720 | 0.865 | 0.493 |
Download Data |
Period Mean (original grids) [W m-2] |
Model Period Mean (intersection) [W m-2] |
Benchmark Period Mean (intersection) [W m-2] |
Model Period Mean (complement) [W m-2] |
Benchmark Period Mean (complement) [W m-2] |
Bias [W m-2] |
RMSE [W m-2] |
Phase Shift [months] |
Bias Score [1] |
RMSE Score [1] |
Seasonal Cycle Score [1] |
Spatial Distribution Score [1] |
Overall Score [1] |
|||
|---|---|---|---|---|---|---|---|---|---|---|---|---|---|---|---|---|
| Benchmark | [-] | -51.4 | ||||||||||||||
| CLM-CRUJRA | [-] | -68.4 | -68.5 | -51.2 | -52.1 | -17.4 | 20.6 | 1.58 | 0.314 | 0.484 | 0.762 | 0.989 | 0.607 | |||
| CLM-GSWP3 | [-] | -70.4 | -70.4 | -51.2 | -52.1 | -19.3 | 22.6 | 1.47 | 0.284 | 0.466 | 0.793 | 0.987 | 0.599 | |||
| CLM-Princeton | [-] | -69.2 | -69.2 | -51.3 | -52.0 | -17.9 | 20.5 | 1.54 | 0.299 | 0.506 | 0.774 | 0.991 | 0.616 | |||
| ISBA-CTRIP-CRUJRA | [-] | -60.5 | -60.5 | -51.3 | -51.6 | -9.25 | 14.5 | 1.42 | 0.466 | 0.514 | 0.786 | 0.960 | 0.648 | |||
| ISBA-CTRIP-GSWP3 | [-] | -60.0 | -60.0 | -51.3 | -51.6 | -8.70 | 15.6 | 1.39 | 0.458 | 0.481 | 0.806 | 0.968 | 0.639 | |||
| ISBA-CTRIP-Princeton | [-] | -60.9 | -61.0 | -51.4 | -51.6 | -9.60 | 14.8 | 1.47 | 0.456 | 0.507 | 0.787 | 0.973 | 0.646 | |||
| Mean-CRUJRA | [-] | -64.1 | -64.3 | -51.3 | -51.8 | -13.0 | 16.8 | 1.44 | 0.386 | 0.518 | 0.782 | 0.987 | 0.638 | |||
| Mean-GSWP3 | [-] | -64.6 | -64.8 | -51.3 | -51.8 | -13.6 | 18.0 | 1.42 | 0.375 | 0.489 | 0.800 | 0.987 | 0.628 | |||
| Mean-Princeton | [-] | -64.6 | -64.8 | -51.3 | -51.8 | -13.4 | 17.0 | 1.50 | 0.375 | 0.517 | 0.781 | 0.989 | 0.636 |
Download Data |
Period Mean (original grids) [W m-2] |
Model Period Mean (intersection) [W m-2] |
Benchmark Period Mean (intersection) [W m-2] |
Model Period Mean (complement) [W m-2] |
Benchmark Period Mean (complement) [W m-2] |
Bias [W m-2] |
RMSE [W m-2] |
Phase Shift [months] |
Bias Score [1] |
RMSE Score [1] |
Seasonal Cycle Score [1] |
Spatial Distribution Score [1] |
Overall Score [1] |
|||
|---|---|---|---|---|---|---|---|---|---|---|---|---|---|---|---|---|
| Benchmark | [-] | -42.2 | ||||||||||||||
| CLM-CRUJRA | [-] | -65.1 | -49.1 | -42.4 | -41.2 | -6.73 | 15.6 | 2.33 | 0.552 | 0.367 | 0.644 | 0.984 | 0.583 | |||
| CLM-GSWP3 | [-] | -55.0 | -43.0 | -42.4 | -41.2 | -0.732 | 17.3 | 1.87 | 0.657 | 0.298 | 0.724 | 0.963 | 0.588 | |||
| CLM-Princeton | [-] | -52.3 | -37.8 | -42.2 | -40.9 | 4.27 | 18.1 | 1.74 | 0.571 | 0.300 | 0.759 | 0.829 | 0.552 | |||
| ISBA-CTRIP-CRUJRA | [-] | -42.4 | -42.5 | -42.3 | -41.3 | -0.201 | 14.0 | 1.92 | 0.664 | 0.387 | 0.723 | 0.988 | 0.630 | |||
| ISBA-CTRIP-GSWP3 | [-] | -37.2 | -37.4 | -42.3 | -41.3 | 4.80 | 17.0 | 1.89 | 0.579 | 0.321 | 0.723 | 0.985 | 0.586 | |||
| ISBA-CTRIP-Princeton | [-] | -33.3 | -33.3 | -42.2 | -40.9 | 8.76 | 19.0 | 1.75 | 0.476 | 0.307 | 0.759 | 0.896 | 0.549 | |||
| Mean-CRUJRA | [-] | -45.4 | -45.5 | -42.3 | -40.5 | -3.20 | 13.9 | 2.09 | 0.635 | 0.396 | 0.687 | 0.989 | 0.621 | |||
| Mean-GSWP3 | [-] | -40.0 | -40.1 | -42.3 | -40.5 | 2.26 | 16.5 | 1.88 | 0.650 | 0.318 | 0.724 | 0.985 | 0.599 | |||
| Mean-Princeton | [-] | -35.0 | -35.3 | -42.2 | -40.1 | 6.84 | 18.3 | 1.75 | 0.525 | 0.308 | 0.759 | 0.872 | 0.554 |
Download Data |
Period Mean (original grids) [W m-2] |
Model Period Mean (intersection) [W m-2] |
Benchmark Period Mean (intersection) [W m-2] |
Model Period Mean (complement) [W m-2] |
Benchmark Period Mean (complement) [W m-2] |
Bias [W m-2] |
RMSE [W m-2] |
Phase Shift [months] |
Bias Score [1] |
RMSE Score [1] |
Seasonal Cycle Score [1] |
Spatial Distribution Score [1] |
Overall Score [1] |
|||
|---|---|---|---|---|---|---|---|---|---|---|---|---|---|---|---|---|
| Benchmark | [-] | -66.8 | ||||||||||||||
| CLM-CRUJRA | [-] | -79.9 | -80.2 | -66.6 | -65.1 | -13.5 | 18.6 | 1.01 | 0.450 | 0.522 | 0.872 | 0.981 | 0.670 | |||
| CLM-GSWP3 | [-] | -73.2 | -73.7 | -66.6 | -65.1 | -7.05 | 15.9 | 1.09 | 0.579 | 0.505 | 0.865 | 0.974 | 0.686 | |||
| CLM-Princeton | [-] | -76.3 | -76.7 | -66.8 | -65.2 | -9.93 | 15.2 | 0.973 | 0.539 | 0.562 | 0.882 | 0.995 | 0.708 | |||
| ISBA-CTRIP-CRUJRA | [-] | -70.0 | -69.9 | -66.7 | -57.5 | -3.29 | 12.9 | 1.12 | 0.656 | 0.556 | 0.860 | 0.925 | 0.710 | |||
| ISBA-CTRIP-GSWP3 | [-] | -63.6 | -63.6 | -66.7 | -57.5 | 2.94 | 14.0 | 1.11 | 0.649 | 0.530 | 0.861 | 0.932 | 0.700 | |||
| ISBA-CTRIP-Princeton | [-] | -67.8 | -67.8 | -66.8 | -57.7 | -1.08 | 11.6 | 0.992 | 0.704 | 0.576 | 0.880 | 0.978 | 0.743 | |||
| Mean-CRUJRA | [-] | -74.5 | -74.8 | -66.7 | -57.3 | -8.09 | 14.6 | 1.10 | 0.564 | 0.563 | 0.861 | 0.939 | 0.698 | |||
| Mean-GSWP3 | [-] | -68.2 | -68.6 | -66.7 | -57.3 | -1.88 | 13.7 | 1.10 | 0.652 | 0.537 | 0.864 | 0.938 | 0.706 | |||
| Mean-Princeton | [-] | -71.5 | -72.0 | -66.8 | -57.4 | -5.21 | 12.5 | 0.975 | 0.647 | 0.582 | 0.882 | 0.982 | 0.735 |
Temporally integrated period mean