Mean State
Download Data |
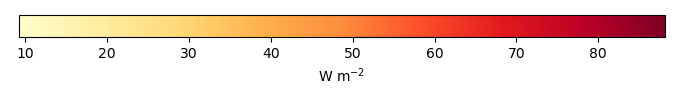
Period Mean (original grids) [W m-2] |
Model Period Mean (intersection) [W m-2] |
Benchmark Period Mean (intersection) [W m-2] |
Model Period Mean (complement) [W m-2] |
Benchmark Period Mean (complement) [W m-2] |
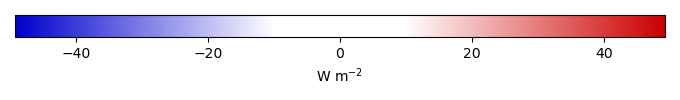
Bias [W m-2] |
RMSE [W m-2] |
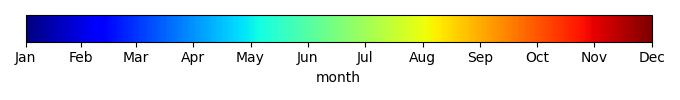
Phase Shift [months] |
Bias Score [1] |
RMSE Score [1] |
Seasonal Cycle Score [1] |
Spatial Distribution Score [1] |
Overall Score [1] |
|||
|---|---|---|---|---|---|---|---|---|---|---|---|---|---|---|---|---|
| Benchmark | [-] | 53.3 | ||||||||||||||
| CLM-CRUJRA | [-] | 52.7 | 52.6 | 53.4 | 45.9 | -0.735 | 18.8 | 0.272 | 0.858 | 0.772 | 0.981 | 0.983 | 0.873 | |||
| CLM-GSWP3 | [-] | 49.8 | 49.7 | 53.4 | 45.9 | -3.69 | 16.2 | 0.166 | 0.884 | 0.789 | 0.988 | 0.987 | 0.887 | |||
| CLM-Princeton | [-] | 48.9 | 48.9 | 53.6 | 46.0 | -4.76 | 16.9 | 0.145 | 0.864 | 0.787 | 0.990 | 0.946 | 0.875 | |||
| ISBA-CTRIP-CRUJRA | [-] | 55.2 | 55.2 | 53.4 | 38.5 | 2.02 | 19.4 | 0.237 | 0.844 | 0.772 | 0.984 | 0.984 | 0.871 | |||
| ISBA-CTRIP-GSWP3 | [-] | 54.5 | 54.6 | 53.4 | 38.5 | 1.32 | 16.5 | 0.196 | 0.896 | 0.782 | 0.986 | 0.986 | 0.886 | |||
| ISBA-CTRIP-Princeton | [-] | 52.8 | 52.9 | 53.5 | 38.7 | -0.481 | 16.8 | 0.148 | 0.886 | 0.780 | 0.990 | 0.963 | 0.880 | |||
| JSBACH-CRUJRA | [-] | 64.7 | 64.4 | 53.9 | 42.6 | 1.99 | 19.2 | 0.224 | 0.843 | 0.773 | 0.984 | 0.975 | 0.869 | |||
| JSBACH-GSWP3 | [-] | 54.5 | 55.5 | 53.9 | 42.6 | 1.55 | 16.7 | 0.167 | 0.893 | 0.779 | 0.988 | 0.989 | 0.886 | |||
| JSBACH-Princeton | [-] | 57.0 | 56.9 | 53.9 | 42.6 | 1.95 | 18.5 | 0.173 | 0.871 | 0.764 | 0.988 | 0.933 | 0.864 | |||
| Mean-CRUJRA | [-] | 55.3 | 55.9 | 53.9 | 42.6 | 1.99 | 19.2 | 0.224 | 0.843 | 0.773 | 0.984 | 0.975 | 0.869 | |||
| Mean-GSWP3 | [-] | 54.5 | 55.5 | 53.9 | 42.6 | 1.55 | 16.7 | 0.167 | 0.893 | 0.779 | 0.988 | 0.989 | 0.886 | |||
| Mean-Princeton | [-] | 55.1 | 55.9 | 53.9 | 42.6 | 1.95 | 18.5 | 0.173 | 0.871 | 0.764 | 0.988 | 0.933 | 0.864 |
Download Data |
Period Mean (original grids) [W m-2] |
Model Period Mean (intersection) [W m-2] |
Benchmark Period Mean (intersection) [W m-2] |
Model Period Mean (complement) [W m-2] |
Benchmark Period Mean (complement) [W m-2] |
Bias [W m-2] |
RMSE [W m-2] |
Phase Shift [months] |
Bias Score [1] |
RMSE Score [1] |
Seasonal Cycle Score [1] |
Spatial Distribution Score [1] |
Overall Score [1] |
|||
|---|---|---|---|---|---|---|---|---|---|---|---|---|---|---|---|---|
| Benchmark | [-] | 91.0 | ||||||||||||||
| CLM-CRUJRA | [-] | 85.5 | 80.9 | 89.2 | 124. | -8.34 | 21.6 | 0.826 | 0.688 | 0.645 | 0.901 | 0.983 | 0.772 | |||
| CLM-GSWP3 | [-] | 80.9 | 76.0 | 89.2 | 124. | -13.2 | 22.1 | 0.666 | 0.646 | 0.665 | 0.920 | 0.969 | 0.773 | |||
| CLM-Princeton | [-] | 78.2 | 74.4 | 89.2 | 124. | -14.7 | 23.4 | 0.618 | 0.615 | 0.678 | 0.927 | 0.919 | 0.764 | |||
| ISBA-CTRIP-CRUJRA | [-] | 89.0 | 88.8 | 90.2 | 134. | -1.31 | 20.9 | 0.839 | 0.708 | 0.650 | 0.901 | 0.984 | 0.779 | |||
| ISBA-CTRIP-GSWP3 | [-] | 86.2 | 86.0 | 90.2 | 134. | -4.09 | 19.3 | 0.643 | 0.723 | 0.665 | 0.925 | 0.979 | 0.792 | |||
| ISBA-CTRIP-Princeton | [-] | 83.9 | 83.7 | 90.2 | 134. | -6.37 | 20.1 | 0.638 | 0.699 | 0.673 | 0.925 | 0.945 | 0.783 | |||
| JSBACH-CRUJRA | [-] | 94.8 | 94.7 | 86.8 | 115. | -5.80 | 21.8 | 0.897 | 0.681 | 0.636 | 0.892 | 0.983 | 0.766 | |||
| JSBACH-GSWP3 | [-] | 86.4 | 83.3 | 86.8 | 115. | -3.59 | 18.0 | 0.737 | 0.739 | 0.665 | 0.908 | 0.986 | 0.792 | |||
| JSBACH-Princeton | [-] | 93.1 | 93.0 | 86.8 | 115. | -7.02 | 20.3 | 0.636 | 0.682 | 0.669 | 0.926 | 0.942 | 0.777 | |||
| Mean-CRUJRA | [-] | 81.1 | 81.0 | 86.8 | 115. | -5.80 | 21.8 | 0.897 | 0.681 | 0.636 | 0.892 | 0.983 | 0.766 | |||
| Mean-GSWP3 | [-] | 83.3 | 83.2 | 86.8 | 115. | -3.59 | 18.0 | 0.737 | 0.739 | 0.665 | 0.908 | 0.986 | 0.792 | |||
| Mean-Princeton | [-] | 79.9 | 79.8 | 86.8 | 115. | -7.02 | 20.3 | 0.636 | 0.682 | 0.669 | 0.926 | 0.942 | 0.777 |
Download Data |
Period Mean (original grids) [W m-2] |
Model Period Mean (intersection) [W m-2] |
Benchmark Period Mean (intersection) [W m-2] |
Model Period Mean (complement) [W m-2] |
Benchmark Period Mean (complement) [W m-2] |
Bias [W m-2] |
RMSE [W m-2] |
Phase Shift [months] |
Bias Score [1] |
RMSE Score [1] |
Seasonal Cycle Score [1] |
Spatial Distribution Score [1] |
Overall Score [1] |
|||
|---|---|---|---|---|---|---|---|---|---|---|---|---|---|---|---|---|
| Benchmark | [-] | 88.7 | ||||||||||||||
| CLM-CRUJRA | [-] | 75.3 | 75.0 | 87.3 | 161. | -12.3 | 21.1 | 0.948 | 0.627 | 0.624 | 0.890 | 0.957 | 0.745 | |||
| CLM-GSWP3 | [-] | 70.5 | 70.5 | 87.3 | 161. | -16.7 | 22.6 | 0.882 | 0.567 | 0.651 | 0.897 | 0.951 | 0.743 | |||
| CLM-Princeton | [-] | 66.8 | 66.7 | 87.2 | 161. | -20.3 | 24.9 | 0.894 | 0.518 | 0.663 | 0.893 | 0.921 | 0.732 | |||
| ISBA-CTRIP-CRUJRA | [-] | 89.0 | 88.7 | 88.3 | 169. | 0.525 | 20.2 | 1.00 | 0.645 | 0.638 | 0.882 | 0.908 | 0.742 | |||
| ISBA-CTRIP-GSWP3 | [-] | 87.0 | 86.9 | 88.3 | 169. | -1.22 | 18.9 | 0.916 | 0.667 | 0.651 | 0.893 | 0.910 | 0.754 | |||
| ISBA-CTRIP-Princeton | [-] | 83.0 | 82.8 | 88.1 | 169. | -5.28 | 19.7 | 0.982 | 0.652 | 0.652 | 0.881 | 0.865 | 0.740 | |||
| JSBACH-CRUJRA | [-] | 69.4 | 69.0 | 84.9 | 138. | -13.4 | 21.6 | 0.981 | 0.597 | 0.620 | 0.885 | 0.989 | 0.742 | |||
| JSBACH-GSWP3 | [-] | 79.2 | 78.9 | 84.9 | 138. | -6.00 | 17.5 | 0.922 | 0.682 | 0.644 | 0.888 | 0.992 | 0.770 | |||
| JSBACH-Princeton | [-] | 69.2 | 68.8 | 84.9 | 138. | -15.0 | 20.8 | 0.929 | 0.586 | 0.658 | 0.885 | 0.989 | 0.755 | |||
| Mean-CRUJRA | [-] | 71.9 | 71.5 | 84.9 | 138. | -13.4 | 21.6 | 0.981 | 0.597 | 0.620 | 0.885 | 0.989 | 0.742 | |||
| Mean-GSWP3 | [-] | 79.2 | 78.9 | 84.9 | 138. | -6.00 | 17.5 | 0.922 | 0.682 | 0.644 | 0.888 | 0.992 | 0.770 | |||
| Mean-Princeton | [-] | 70.1 | 69.9 | 84.9 | 138. | -15.0 | 20.8 | 0.929 | 0.586 | 0.658 | 0.885 | 0.989 | 0.755 |
Download Data |
Period Mean (original grids) [W m-2] |
Model Period Mean (intersection) [W m-2] |
Benchmark Period Mean (intersection) [W m-2] |
Model Period Mean (complement) [W m-2] |
Benchmark Period Mean (complement) [W m-2] |
Bias [W m-2] |
RMSE [W m-2] |
Phase Shift [months] |
Bias Score [1] |
RMSE Score [1] |
Seasonal Cycle Score [1] |
Spatial Distribution Score [1] |
Overall Score [1] |
|||
|---|---|---|---|---|---|---|---|---|---|---|---|---|---|---|---|---|
| Benchmark | [-] | 74.8 | ||||||||||||||
| CLM-CRUJRA | [-] | 63.3 | 63.4 | 74.5 | 125. | -10.9 | 20.7 | 0.586 | 0.760 | 0.744 | 0.949 | 0.985 | 0.836 | |||
| CLM-GSWP3 | [-] | 63.8 | 63.7 | 74.5 | 125. | -10.6 | 19.0 | 0.384 | 0.760 | 0.773 | 0.969 | 0.974 | 0.850 | |||
| CLM-Princeton | [-] | 60.1 | 60.0 | 74.6 | 125. | -14.4 | 20.2 | 0.400 | 0.729 | 0.779 | 0.967 | 0.992 | 0.849 | |||
| ISBA-CTRIP-CRUJRA | [-] | 70.1 | 69.6 | 74.7 | 131. | -5.18 | 20.3 | 0.607 | 0.780 | 0.725 | 0.947 | 0.989 | 0.833 | |||
| ISBA-CTRIP-GSWP3 | [-] | 73.5 | 72.8 | 74.7 | 131. | -1.90 | 16.7 | 0.381 | 0.821 | 0.766 | 0.968 | 0.980 | 0.860 | |||
| ISBA-CTRIP-Princeton | [-] | 70.1 | 69.4 | 74.7 | 130. | -5.32 | 16.8 | 0.388 | 0.818 | 0.768 | 0.969 | 0.993 | 0.863 | |||
| JSBACH-CRUJRA | [-] | 86.3 | 84.3 | 74.0 | 96.1 | -10.3 | 20.6 | 0.570 | 0.742 | 0.753 | 0.949 | 0.971 | 0.834 | |||
| JSBACH-GSWP3 | [-] | 74.0 | 72.9 | 74.0 | 96.1 | -1.40 | 16.2 | 0.366 | 0.816 | 0.776 | 0.970 | 0.955 | 0.859 | |||
| JSBACH-Princeton | [-] | 87.3 | 80.9 | 74.0 | 96.1 | -7.64 | 17.4 | 0.442 | 0.793 | 0.775 | 0.963 | 0.992 | 0.860 | |||
| Mean-CRUJRA | [-] | 64.1 | 63.8 | 74.0 | 96.1 | -10.3 | 20.6 | 0.570 | 0.742 | 0.753 | 0.949 | 0.971 | 0.834 | |||
| Mean-GSWP3 | [-] | 74.0 | 72.9 | 74.0 | 96.1 | -1.40 | 16.2 | 0.366 | 0.816 | 0.776 | 0.970 | 0.955 | 0.859 | |||
| Mean-Princeton | [-] | 67.5 | 66.5 | 74.0 | 96.1 | -7.64 | 17.4 | 0.442 | 0.793 | 0.775 | 0.963 | 0.992 | 0.860 |
Download Data |
Period Mean (original grids) [W m-2] |
Model Period Mean (intersection) [W m-2] |
Benchmark Period Mean (intersection) [W m-2] |
Model Period Mean (complement) [W m-2] |
Benchmark Period Mean (complement) [W m-2] |
Bias [W m-2] |
RMSE [W m-2] |
Phase Shift [months] |
Bias Score [1] |
RMSE Score [1] |
Seasonal Cycle Score [1] |
Spatial Distribution Score [1] |
Overall Score [1] |
|||
|---|---|---|---|---|---|---|---|---|---|---|---|---|---|---|---|---|
| Benchmark | [-] | 67.8 | ||||||||||||||
| CLM-CRUJRA | [-] | 87.2 | 89.0 | 69.6 | 57.9 | 19.0 | 28.7 | 0.836 | 0.555 | 0.599 | 0.884 | 0.987 | 0.725 | |||
| CLM-GSWP3 | [-] | 73.7 | 74.8 | 69.6 | 57.9 | 4.70 | 20.9 | 0.821 | 0.684 | 0.627 | 0.866 | 0.949 | 0.751 | |||
| CLM-Princeton | [-] | 73.4 | 74.8 | 69.3 | 57.7 | 5.21 | 19.4 | 0.806 | 0.704 | 0.645 | 0.878 | 0.992 | 0.773 | |||
| ISBA-CTRIP-CRUJRA | [-] | 83.6 | 88.4 | 67.9 | 59.4 | 20.7 | 28.9 | 0.840 | 0.578 | 0.628 | 0.885 | 0.981 | 0.740 | |||
| ISBA-CTRIP-GSWP3 | [-] | 68.8 | 75.4 | 67.9 | 59.4 | 7.58 | 21.9 | 0.716 | 0.700 | 0.649 | 0.886 | 0.929 | 0.763 | |||
| ISBA-CTRIP-Princeton | [-] | 69.9 | 75.0 | 67.7 | 59.1 | 7.34 | 20.3 | 0.510 | 0.721 | 0.659 | 0.932 | 0.986 | 0.792 | |||
| JSBACH-CRUJRA | [-] | 118. | 121. | 70.0 | 63.6 | 20.3 | 29.9 | 1.17 | 0.525 | 0.544 | 0.827 | 0.982 | 0.684 | |||
| JSBACH-GSWP3 | [-] | 76.5 | 79.0 | 70.0 | 63.6 | 8.77 | 21.5 | 1.04 | 0.596 | 0.594 | 0.833 | 0.974 | 0.718 | |||
| JSBACH-Princeton | [-] | 99.3 | 106. | 70.0 | 63.6 | 10.9 | 21.8 | 0.927 | 0.606 | 0.586 | 0.853 | 0.980 | 0.722 | |||
| Mean-CRUJRA | [-] | 88.9 | 90.5 | 70.0 | 63.6 | 20.3 | 29.9 | 1.17 | 0.525 | 0.544 | 0.827 | 0.982 | 0.684 | |||
| Mean-GSWP3 | [-] | 76.5 | 79.0 | 70.0 | 63.6 | 8.77 | 21.5 | 1.04 | 0.596 | 0.594 | 0.833 | 0.974 | 0.718 | |||
| Mean-Princeton | [-] | 79.7 | 81.0 | 70.0 | 63.6 | 10.9 | 21.8 | 0.927 | 0.606 | 0.586 | 0.853 | 0.980 | 0.722 |
Download Data |
Period Mean (original grids) [W m-2] |
Model Period Mean (intersection) [W m-2] |
Benchmark Period Mean (intersection) [W m-2] |
Model Period Mean (complement) [W m-2] |
Benchmark Period Mean (complement) [W m-2] |
Bias [W m-2] |
RMSE [W m-2] |
Phase Shift [months] |
Bias Score [1] |
RMSE Score [1] |
Seasonal Cycle Score [1] |
Spatial Distribution Score [1] |
Overall Score [1] |
|||
|---|---|---|---|---|---|---|---|---|---|---|---|---|---|---|---|---|
| Benchmark | [-] | 77.5 | ||||||||||||||
| CLM-CRUJRA | [-] | 80.6 | 80.6 | 77.7 | 71.8 | 2.94 | 19.0 | 0.534 | 0.820 | 0.756 | 0.953 | 0.993 | 0.856 | |||
| CLM-GSWP3 | [-] | 69.3 | 69.1 | 77.7 | 71.8 | -8.66 | 18.6 | 0.418 | 0.807 | 0.765 | 0.964 | 0.994 | 0.859 | |||
| CLM-Princeton | [-] | 68.4 | 68.4 | 77.6 | 71.5 | -9.23 | 17.1 | 0.329 | 0.809 | 0.792 | 0.971 | 0.995 | 0.872 | |||
| ISBA-CTRIP-CRUJRA | [-] | 85.8 | 85.8 | 77.5 | 67.2 | 8.35 | 19.9 | 0.578 | 0.807 | 0.760 | 0.951 | 0.992 | 0.854 | |||
| ISBA-CTRIP-GSWP3 | [-] | 75.0 | 75.3 | 77.5 | 67.2 | -2.13 | 17.0 | 0.444 | 0.861 | 0.763 | 0.962 | 0.989 | 0.868 | |||
| ISBA-CTRIP-Princeton | [-] | 73.9 | 74.4 | 77.5 | 67.1 | -2.98 | 15.2 | 0.285 | 0.863 | 0.788 | 0.976 | 0.996 | 0.882 | |||
| JSBACH-CRUJRA | [-] | 104. | 103. | 77.4 | 78.0 | 6.13 | 19.6 | 0.642 | 0.818 | 0.748 | 0.946 | 0.992 | 0.851 | |||
| JSBACH-GSWP3 | [-] | 75.3 | 75.6 | 77.4 | 78.0 | -1.89 | 16.8 | 0.473 | 0.861 | 0.757 | 0.960 | 0.988 | 0.865 | |||
| JSBACH-Princeton | [-] | 83.8 | 83.3 | 77.4 | 78.0 | -1.71 | 15.4 | 0.382 | 0.877 | 0.772 | 0.967 | 0.995 | 0.877 | |||
| Mean-CRUJRA | [-] | 83.5 | 83.6 | 77.4 | 78.0 | 6.13 | 19.6 | 0.642 | 0.818 | 0.748 | 0.946 | 0.992 | 0.851 | |||
| Mean-GSWP3 | [-] | 75.3 | 75.6 | 77.4 | 78.0 | -1.89 | 16.8 | 0.473 | 0.861 | 0.757 | 0.960 | 0.988 | 0.865 | |||
| Mean-Princeton | [-] | 75.4 | 75.7 | 77.4 | 78.0 | -1.71 | 15.4 | 0.382 | 0.877 | 0.772 | 0.967 | 0.995 | 0.877 |
Download Data |
Period Mean (original grids) [W m-2] |
Model Period Mean (intersection) [W m-2] |
Benchmark Period Mean (intersection) [W m-2] |
Model Period Mean (complement) [W m-2] |
Benchmark Period Mean (complement) [W m-2] |
Bias [W m-2] |
RMSE [W m-2] |
Phase Shift [months] |
Bias Score [1] |
RMSE Score [1] |
Seasonal Cycle Score [1] |
Spatial Distribution Score [1] |
Overall Score [1] |
|||
|---|---|---|---|---|---|---|---|---|---|---|---|---|---|---|---|---|
| Benchmark | [-] | 138. | ||||||||||||||
| CLM-CRUJRA | [-] | 137. | 137. | 137. | 146. | -0.735 | 19.3 | 1.54 | 0.569 | 0.397 | 0.768 | 0.901 | 0.607 | |||
| CLM-GSWP3 | [-] | 122. | 122. | 137. | 146. | -14.8 | 22.8 | 1.19 | 0.365 | 0.416 | 0.821 | 0.984 | 0.601 | |||
| CLM-Princeton | [-] | 116. | 115. | 137. | 146. | -21.6 | 26.0 | 0.961 | 0.276 | 0.492 | 0.870 | 0.850 | 0.596 | |||
| ISBA-CTRIP-CRUJRA | [-] | 140. | 140. | 137. | 154. | 2.26 | 19.3 | 1.49 | 0.562 | 0.406 | 0.780 | 0.948 | 0.620 | |||
| ISBA-CTRIP-GSWP3 | [-] | 129. | 128. | 137. | 154. | -8.84 | 20.3 | 1.22 | 0.448 | 0.423 | 0.817 | 0.996 | 0.621 | |||
| ISBA-CTRIP-Princeton | [-] | 121. | 121. | 137. | 155. | -16.0 | 22.4 | 1.05 | 0.363 | 0.488 | 0.854 | 0.971 | 0.633 | |||
| JSBACH-CRUJRA | [-] | 139. | 140. | 137. | 141. | 2.42 | 18.2 | 1.81 | 0.593 | 0.392 | 0.719 | 0.871 | 0.593 | |||
| JSBACH-GSWP3 | [-] | 128. | 129. | 137. | 141. | -8.08 | 17.7 | 1.24 | 0.500 | 0.425 | 0.814 | 0.937 | 0.620 | |||
| JSBACH-Princeton | [-] | 120. | 120. | 137. | 141. | -16.2 | 21.9 | 0.910 | 0.332 | 0.470 | 0.874 | 0.713 | 0.572 | |||
| Mean-CRUJRA | [-] | 139. | 139. | 137. | 141. | 2.42 | 18.2 | 1.81 | 0.593 | 0.392 | 0.719 | 0.871 | 0.593 | |||
| Mean-GSWP3 | [-] | 128. | 129. | 137. | 141. | -8.08 | 17.7 | 1.24 | 0.500 | 0.425 | 0.814 | 0.937 | 0.620 | |||
| Mean-Princeton | [-] | 120. | 121. | 137. | 141. | -16.2 | 21.9 | 0.910 | 0.332 | 0.470 | 0.874 | 0.713 | 0.572 |
Download Data |
Period Mean (original grids) [W m-2] |
Model Period Mean (intersection) [W m-2] |
Benchmark Period Mean (intersection) [W m-2] |
Model Period Mean (complement) [W m-2] |
Benchmark Period Mean (complement) [W m-2] |
Bias [W m-2] |
RMSE [W m-2] |
Phase Shift [months] |
Bias Score [1] |
RMSE Score [1] |
Seasonal Cycle Score [1] |
Spatial Distribution Score [1] |
Overall Score [1] |
|||
|---|---|---|---|---|---|---|---|---|---|---|---|---|---|---|---|---|
| Benchmark | [-] | 137. | ||||||||||||||
| CLM-CRUJRA | [-] | 121. | 121. | 136. | 159. | -14.2 | 24.1 | 1.45 | 0.508 | 0.491 | 0.797 | 0.996 | 0.657 | |||
| CLM-GSWP3 | [-] | 114. | 114. | 136. | 159. | -21.6 | 27.0 | 1.16 | 0.403 | 0.523 | 0.840 | 0.997 | 0.657 | |||
| CLM-Princeton | [-] | 112. | 112. | 135. | 158. | -23.4 | 27.6 | 1.01 | 0.373 | 0.554 | 0.863 | 0.982 | 0.665 | |||
| ISBA-CTRIP-CRUJRA | [-] | 129. | 129. | 136. | 162. | -7.16 | 21.2 | 1.34 | 0.584 | 0.498 | 0.819 | 0.967 | 0.673 | |||
| ISBA-CTRIP-GSWP3 | [-] | 124. | 125. | 136. | 162. | -11.4 | 20.5 | 0.965 | 0.555 | 0.530 | 0.870 | 0.998 | 0.697 | |||
| ISBA-CTRIP-Princeton | [-] | 121. | 122. | 136. | 162. | -14.1 | 21.4 | 0.969 | 0.516 | 0.550 | 0.869 | 0.976 | 0.692 | |||
| JSBACH-CRUJRA | [-] | 123. | 122. | 134. | 150. | -12.4 | 24.1 | 1.61 | 0.522 | 0.456 | 0.774 | 0.996 | 0.641 | |||
| JSBACH-GSWP3 | [-] | 125. | 124. | 134. | 150. | -9.69 | 18.9 | 1.40 | 0.592 | 0.520 | 0.795 | 0.995 | 0.685 | |||
| JSBACH-Princeton | [-] | 123. | 122. | 134. | 150. | -14.7 | 20.7 | 0.963 | 0.508 | 0.548 | 0.871 | 0.915 | 0.678 | |||
| Mean-CRUJRA | [-] | 122. | 122. | 134. | 150. | -12.4 | 24.1 | 1.61 | 0.522 | 0.456 | 0.774 | 0.996 | 0.641 | |||
| Mean-GSWP3 | [-] | 125. | 124. | 134. | 150. | -9.69 | 18.9 | 1.40 | 0.592 | 0.520 | 0.795 | 0.995 | 0.685 | |||
| Mean-Princeton | [-] | 120. | 119. | 134. | 150. | -14.7 | 20.7 | 0.963 | 0.508 | 0.548 | 0.871 | 0.915 | 0.678 |
Download Data |
Period Mean (original grids) [W m-2] |
Model Period Mean (intersection) [W m-2] |
Benchmark Period Mean (intersection) [W m-2] |
Model Period Mean (complement) [W m-2] |
Benchmark Period Mean (complement) [W m-2] |
Bias [W m-2] |
RMSE [W m-2] |
Phase Shift [months] |
Bias Score [1] |
RMSE Score [1] |
Seasonal Cycle Score [1] |
Spatial Distribution Score [1] |
Overall Score [1] |
|||
|---|---|---|---|---|---|---|---|---|---|---|---|---|---|---|---|---|
| Benchmark | [-] | 23.1 | ||||||||||||||
| CLM-CRUJRA | [-] | 19.4 | 19.9 | 23.2 | 10.9 | -3.27 | 20.1 | 0.287 | 0.812 | 0.718 | 0.979 | 0.840 | 0.813 | |||
| CLM-GSWP3 | [-] | 36.7 | 22.5 | 23.2 | 10.9 | -0.801 | 19.0 | 0.167 | 0.842 | 0.714 | 0.987 | 0.933 | 0.838 | |||
| CLM-Princeton | [-] | 38.2 | 29.6 | 23.5 | 11.5 | 6.03 | 22.2 | 0.221 | 0.814 | 0.680 | 0.984 | 0.951 | 0.822 | |||
| ISBA-CTRIP-CRUJRA | [-] | 24.4 | 24.5 | 23.1 | 6.53 | 1.49 | 19.5 | 0.308 | 0.800 | 0.733 | 0.978 | 0.844 | 0.818 | |||
| ISBA-CTRIP-GSWP3 | [-] | 27.2 | 27.1 | 23.1 | 6.53 | 4.08 | 19.5 | 0.199 | 0.823 | 0.717 | 0.985 | 0.917 | 0.832 | |||
| ISBA-CTRIP-Princeton | [-] | 31.8 | 31.9 | 23.3 | 7.11 | 8.66 | 23.1 | 0.316 | 0.793 | 0.677 | 0.978 | 0.958 | 0.817 | |||
| JSBACH-CRUJRA | [-] | 15.3 | 15.2 | 24.2 | 11.5 | 1.99 | 23.3 | 0.306 | 0.766 | 0.693 | 0.978 | 0.782 | 0.782 | |||
| JSBACH-GSWP3 | [-] | 35.2 | 29.6 | 24.2 | 11.5 | 5.39 | 20.3 | 0.154 | 0.810 | 0.710 | 0.988 | 0.897 | 0.823 | |||
| JSBACH-Princeton | [-] | 27.3 | 27.3 | 24.2 | 11.5 | 12.3 | 27.2 | 0.290 | 0.744 | 0.644 | 0.979 | 0.944 | 0.791 | |||
| Mean-CRUJRA | [-] | 26.4 | 26.2 | 24.2 | 11.5 | 1.99 | 23.3 | 0.306 | 0.766 | 0.693 | 0.978 | 0.782 | 0.782 | |||
| Mean-GSWP3 | [-] | 29.9 | 29.6 | 24.2 | 11.5 | 5.39 | 20.3 | 0.154 | 0.810 | 0.710 | 0.988 | 0.897 | 0.823 | |||
| Mean-Princeton | [-] | 36.7 | 36.5 | 24.2 | 11.5 | 12.3 | 27.2 | 0.290 | 0.744 | 0.644 | 0.979 | 0.944 | 0.791 |
Download Data |
Period Mean (original grids) [W m-2] |
Model Period Mean (intersection) [W m-2] |
Benchmark Period Mean (intersection) [W m-2] |
Model Period Mean (complement) [W m-2] |
Benchmark Period Mean (complement) [W m-2] |
Bias [W m-2] |
RMSE [W m-2] |
Phase Shift [months] |
Bias Score [1] |
RMSE Score [1] |
Seasonal Cycle Score [1] |
Spatial Distribution Score [1] |
Overall Score [1] |
|||
|---|---|---|---|---|---|---|---|---|---|---|---|---|---|---|---|---|
| Benchmark | [-] | 82.5 | ||||||||||||||
| CLM-CRUJRA | [-] | 74.4 | 74.2 | 82.1 | 105. | -7.99 | 19.6 | 0.447 | 0.808 | 0.761 | 0.962 | 0.992 | 0.857 | |||
| CLM-GSWP3 | [-] | 71.7 | 71.3 | 82.1 | 105. | -10.9 | 19.6 | 0.411 | 0.793 | 0.767 | 0.965 | 0.995 | 0.857 | |||
| CLM-Princeton | [-] | 68.7 | 68.5 | 82.0 | 105. | -13.6 | 20.3 | 0.364 | 0.766 | 0.776 | 0.969 | 0.987 | 0.855 | |||
| ISBA-CTRIP-CRUJRA | [-] | 82.7 | 82.1 | 82.4 | 104. | -0.343 | 18.9 | 0.576 | 0.824 | 0.758 | 0.950 | 0.988 | 0.856 | |||
| ISBA-CTRIP-GSWP3 | [-] | 80.9 | 79.9 | 82.4 | 104. | -2.58 | 17.1 | 0.444 | 0.855 | 0.766 | 0.962 | 0.989 | 0.868 | |||
| ISBA-CTRIP-Princeton | [-] | 78.1 | 77.2 | 82.4 | 104. | -5.14 | 16.4 | 0.383 | 0.851 | 0.781 | 0.966 | 0.996 | 0.875 | |||
| JSBACH-CRUJRA | [-] | 91.7 | 93.6 | 81.3 | 97.1 | -2.31 | 19.5 | 0.623 | 0.804 | 0.755 | 0.945 | 0.980 | 0.848 | |||
| JSBACH-GSWP3 | [-] | 81.9 | 81.6 | 81.3 | 97.1 | 0.383 | 16.6 | 0.458 | 0.860 | 0.765 | 0.961 | 0.995 | 0.869 | |||
| JSBACH-Princeton | [-] | 86.5 | 89.2 | 81.3 | 97.1 | -3.03 | 17.0 | 0.436 | 0.849 | 0.770 | 0.961 | 0.981 | 0.866 | |||
| Mean-CRUJRA | [-] | 79.3 | 78.9 | 81.3 | 97.1 | -2.31 | 19.5 | 0.623 | 0.804 | 0.755 | 0.945 | 0.980 | 0.848 | |||
| Mean-GSWP3 | [-] | 81.9 | 81.6 | 81.3 | 97.1 | 0.383 | 16.6 | 0.458 | 0.860 | 0.765 | 0.961 | 0.995 | 0.869 | |||
| Mean-Princeton | [-] | 78.6 | 78.2 | 81.3 | 97.1 | -3.03 | 17.0 | 0.436 | 0.849 | 0.770 | 0.961 | 0.981 | 0.866 |
Temporally integrated period mean