Mean State
Download Data |
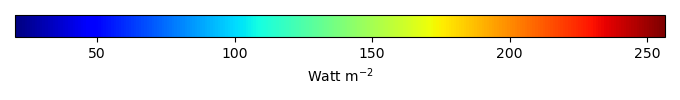
Period Mean (original grids) [Watt m-2] |
Model Period Mean (intersection) [Watt m-2] |
Benchmark Period Mean (intersection) [Watt m-2] |
Model Period Mean (complement) [Watt m-2] |
Benchmark Period Mean (complement) [Watt m-2] |
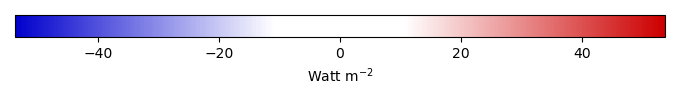
Bias [Watt m-2] |
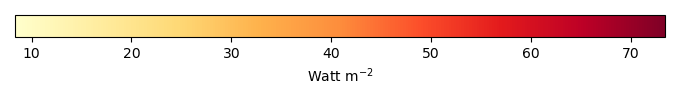
RMSE [Watt m-2] |
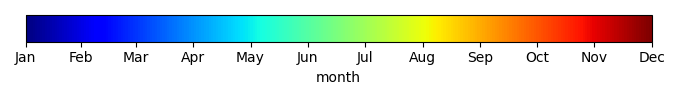
Phase Shift [months] |
Bias Score [1] |
RMSE Score [1] |
Seasonal Cycle Score [1] |
Spatial Distribution Score [1] |
Overall Score [1] |
|||
|---|---|---|---|---|---|---|---|---|---|---|---|---|---|---|---|---|
| Benchmark | [-] | 108. | ||||||||||||||
| CLM-CRUJRA | [-] | 110. | 110. | 108. | 99.4 | 1.66 | 22.2 | 0.230 | 0.865 | 0.741 | 0.984 | 0.992 | 0.865 | |||
| CLM-GSWP3 | [-] | 104. | 104. | 108. | 99.4 | -4.12 | 16.2 | 0.141 | 0.911 | 0.792 | 0.990 | 0.996 | 0.896 | |||
| CLM-Princeton | [-] | 104. | 104. | 108. | 99.4 | -3.51 | 15.0 | 0.164 | 0.897 | 0.813 | 0.989 | 0.998 | 0.902 | |||
| ISBA-CTRIP-CRUJRA | [-] | 106. | 106. | 108. | 93.8 | -1.39 | 24.2 | 0.230 | 0.851 | 0.729 | 0.984 | 0.985 | 0.855 | |||
| ISBA-CTRIP-GSWP3 | [-] | 101. | 102. | 108. | 93.8 | -5.80 | 17.7 | 0.127 | 0.891 | 0.781 | 0.991 | 0.998 | 0.888 | |||
| ISBA-CTRIP-Princeton | [-] | 102. | 103. | 108. | 93.8 | -4.95 | 16.6 | 0.159 | 0.887 | 0.797 | 0.989 | 0.997 | 0.893 | |||
| Mean-CRUJRA | [-] | 108. | 109. | 108. | 99.9 | 1.30 | 21.0 | 0.218 | 0.869 | 0.754 | 0.985 | 0.988 | 0.870 | |||
| Mean-GSWP3 | [-] | 102. | 103. | 108. | 99.9 | -4.79 | 15.2 | 0.111 | 0.916 | 0.803 | 0.992 | 0.999 | 0.902 | |||
| Mean-Princeton | [-] | 104. | 105. | 108. | 99.9 | -3.05 | 14.1 | 0.164 | 0.906 | 0.821 | 0.988 | 0.998 | 0.907 |
Download Data |
Period Mean (original grids) [Watt m-2] |
Model Period Mean (intersection) [Watt m-2] |
Benchmark Period Mean (intersection) [Watt m-2] |
Model Period Mean (complement) [Watt m-2] |
Benchmark Period Mean (complement) [Watt m-2] |
Bias [Watt m-2] |
RMSE [Watt m-2] |
Phase Shift [months] |
Bias Score [1] |
RMSE Score [1] |
Seasonal Cycle Score [1] |
Spatial Distribution Score [1] |
Overall Score [1] |
|||
|---|---|---|---|---|---|---|---|---|---|---|---|---|---|---|---|---|
| Benchmark | [-] | 154. | ||||||||||||||
| CLM-CRUJRA | [-] | 162. | 155. | 152. | 186. | 2.83 | 23.3 | 0.616 | 0.735 | 0.636 | 0.932 | 0.992 | 0.786 | |||
| CLM-GSWP3 | [-] | 156. | 149. | 152. | 186. | -3.48 | 17.9 | 0.296 | 0.815 | 0.681 | 0.970 | 0.992 | 0.828 | |||
| CLM-Princeton | [-] | 156. | 149. | 152. | 186. | -3.49 | 16.3 | 0.400 | 0.803 | 0.730 | 0.957 | 0.996 | 0.843 | |||
| ISBA-CTRIP-CRUJRA | [-] | 155. | 155. | 153. | 194. | 1.28 | 23.9 | 0.537 | 0.730 | 0.640 | 0.944 | 0.992 | 0.789 | |||
| ISBA-CTRIP-GSWP3 | [-] | 149. | 149. | 153. | 194. | -4.11 | 18.7 | 0.255 | 0.802 | 0.679 | 0.975 | 0.993 | 0.826 | |||
| ISBA-CTRIP-Princeton | [-] | 150. | 150. | 153. | 194. | -3.44 | 17.2 | 0.372 | 0.794 | 0.726 | 0.963 | 0.995 | 0.841 | |||
| Mean-CRUJRA | [-] | 155. | 155. | 154. | 189. | 1.63 | 22.5 | 0.559 | 0.742 | 0.648 | 0.941 | 0.995 | 0.795 | |||
| Mean-GSWP3 | [-] | 149. | 149. | 154. | 189. | -4.56 | 17.1 | 0.232 | 0.829 | 0.693 | 0.978 | 0.996 | 0.838 | |||
| Mean-Princeton | [-] | 150. | 150. | 154. | 189. | -3.81 | 15.6 | 0.344 | 0.814 | 0.743 | 0.966 | 0.997 | 0.853 |
Download Data |
Period Mean (original grids) [Watt m-2] |
Model Period Mean (intersection) [Watt m-2] |
Benchmark Period Mean (intersection) [Watt m-2] |
Model Period Mean (complement) [Watt m-2] |
Benchmark Period Mean (complement) [Watt m-2] |
Bias [Watt m-2] |
RMSE [Watt m-2] |
Phase Shift [months] |
Bias Score [1] |
RMSE Score [1] |
Seasonal Cycle Score [1] |
Spatial Distribution Score [1] |
Overall Score [1] |
|||
|---|---|---|---|---|---|---|---|---|---|---|---|---|---|---|---|---|
| Benchmark | [-] | 183. | ||||||||||||||
| CLM-CRUJRA | [-] | 182. | 182. | 182. | 231. | -0.462 | 21.3 | 0.687 | 0.691 | 0.640 | 0.915 | 0.965 | 0.770 | |||
| CLM-GSWP3 | [-] | 178. | 178. | 182. | 231. | -4.46 | 18.3 | 0.344 | 0.736 | 0.674 | 0.964 | 0.973 | 0.804 | |||
| CLM-Princeton | [-] | 177. | 177. | 182. | 231. | -4.98 | 17.3 | 0.484 | 0.724 | 0.717 | 0.943 | 0.970 | 0.814 | |||
| ISBA-CTRIP-CRUJRA | [-] | 184. | 184. | 183. | 232. | 1.06 | 21.3 | 0.510 | 0.687 | 0.660 | 0.949 | 0.995 | 0.790 | |||
| ISBA-CTRIP-GSWP3 | [-] | 181. | 181. | 183. | 232. | -2.13 | 18.2 | 0.287 | 0.735 | 0.680 | 0.973 | 0.992 | 0.812 | |||
| ISBA-CTRIP-Princeton | [-] | 182. | 181. | 183. | 232. | -1.62 | 16.6 | 0.391 | 0.742 | 0.723 | 0.962 | 0.988 | 0.828 | |||
| Mean-CRUJRA | [-] | 182. | 182. | 183. | 192. | -1.59 | 19.8 | 0.567 | 0.719 | 0.657 | 0.937 | 0.998 | 0.794 | |||
| Mean-GSWP3 | [-] | 178. | 178. | 183. | 192. | -5.04 | 16.6 | 0.259 | 0.775 | 0.691 | 0.976 | 0.998 | 0.826 | |||
| Mean-Princeton | [-] | 178. | 178. | 183. | 192. | -4.86 | 15.2 | 0.375 | 0.766 | 0.736 | 0.963 | 0.998 | 0.840 |
Download Data |
Period Mean (original grids) [Watt m-2] |
Model Period Mean (intersection) [Watt m-2] |
Benchmark Period Mean (intersection) [Watt m-2] |
Model Period Mean (complement) [Watt m-2] |
Benchmark Period Mean (complement) [Watt m-2] |
Bias [Watt m-2] |
RMSE [Watt m-2] |
Phase Shift [months] |
Bias Score [1] |
RMSE Score [1] |
Seasonal Cycle Score [1] |
Spatial Distribution Score [1] |
Overall Score [1] |
|||
|---|---|---|---|---|---|---|---|---|---|---|---|---|---|---|---|---|
| Benchmark | [-] | 159. | ||||||||||||||
| CLM-CRUJRA | [-] | 160. | 159. | 159. | 194. | 0.339 | 20.9 | 0.457 | 0.847 | 0.743 | 0.965 | 0.953 | 0.850 | |||
| CLM-GSWP3 | [-] | 155. | 154. | 159. | 194. | -4.89 | 16.5 | 0.191 | 0.886 | 0.785 | 0.986 | 0.991 | 0.887 | |||
| CLM-Princeton | [-] | 158. | 157. | 159. | 194. | -1.61 | 15.2 | 0.337 | 0.885 | 0.808 | 0.976 | 0.985 | 0.892 | |||
| ISBA-CTRIP-CRUJRA | [-] | 155. | 154. | 159. | 198. | -4.59 | 26.0 | 0.462 | 0.818 | 0.692 | 0.966 | 0.973 | 0.828 | |||
| ISBA-CTRIP-GSWP3 | [-] | 153. | 152. | 159. | 198. | -6.84 | 19.3 | 0.179 | 0.867 | 0.757 | 0.987 | 0.996 | 0.873 | |||
| ISBA-CTRIP-Princeton | [-] | 157. | 157. | 159. | 198. | -2.39 | 17.8 | 0.342 | 0.880 | 0.774 | 0.974 | 0.991 | 0.879 | |||
| Mean-CRUJRA | [-] | 158. | 158. | 159. | 171. | -1.08 | 20.5 | 0.426 | 0.848 | 0.747 | 0.969 | 0.925 | 0.847 | |||
| Mean-GSWP3 | [-] | 154. | 153. | 159. | 171. | -5.64 | 15.6 | 0.157 | 0.894 | 0.795 | 0.989 | 0.998 | 0.894 | |||
| Mean-Princeton | [-] | 158. | 158. | 159. | 171. | -1.45 | 13.7 | 0.322 | 0.907 | 0.818 | 0.976 | 0.994 | 0.903 |
Download Data |
Period Mean (original grids) [Watt m-2] |
Model Period Mean (intersection) [Watt m-2] |
Benchmark Period Mean (intersection) [Watt m-2] |
Model Period Mean (complement) [Watt m-2] |
Benchmark Period Mean (complement) [Watt m-2] |
Bias [Watt m-2] |
RMSE [Watt m-2] |
Phase Shift [months] |
Bias Score [1] |
RMSE Score [1] |
Seasonal Cycle Score [1] |
Spatial Distribution Score [1] |
Overall Score [1] |
|||
|---|---|---|---|---|---|---|---|---|---|---|---|---|---|---|---|---|
| Benchmark | [-] | 123. | ||||||||||||||
| CLM-CRUJRA | [-] | 136. | 142. | 124. | 113. | 17.5 | 27.5 | 0.973 | 0.600 | 0.613 | 0.852 | 0.996 | 0.735 | |||
| CLM-GSWP3 | [-] | 119. | 125. | 124. | 113. | 0.405 | 18.2 | 0.533 | 0.800 | 0.643 | 0.934 | 0.993 | 0.803 | |||
| CLM-Princeton | [-] | 122. | 127. | 124. | 113. | 2.83 | 17.5 | 0.773 | 0.764 | 0.676 | 0.887 | 0.998 | 0.800 | |||
| ISBA-CTRIP-CRUJRA | [-] | 132. | 137. | 123. | 112. | 14.3 | 25.6 | 0.912 | 0.645 | 0.641 | 0.862 | 0.991 | 0.756 | |||
| ISBA-CTRIP-GSWP3 | [-] | 114. | 120. | 123. | 112. | -3.32 | 19.3 | 0.565 | 0.805 | 0.655 | 0.929 | 0.990 | 0.807 | |||
| ISBA-CTRIP-Princeton | [-] | 117. | 122. | 123. | 112. | -1.28 | 17.6 | 0.825 | 0.791 | 0.691 | 0.878 | 0.996 | 0.809 | |||
| Mean-CRUJRA | [-] | 140. | 138. | 123. | 112. | 15.1 | 25.3 | 0.924 | 0.652 | 0.642 | 0.855 | 0.997 | 0.758 | |||
| Mean-GSWP3 | [-] | 122. | 121. | 123. | 112. | -2.12 | 17.2 | 0.435 | 0.833 | 0.670 | 0.940 | 0.996 | 0.822 | |||
| Mean-Princeton | [-] | 125. | 123. | 123. | 112. | 0.371 | 16.6 | 0.588 | 0.788 | 0.703 | 0.910 | 0.997 | 0.820 |
Download Data |
Period Mean (original grids) [Watt m-2] |
Model Period Mean (intersection) [Watt m-2] |
Benchmark Period Mean (intersection) [Watt m-2] |
Model Period Mean (complement) [Watt m-2] |
Benchmark Period Mean (complement) [Watt m-2] |
Bias [Watt m-2] |
RMSE [Watt m-2] |
Phase Shift [months] |
Bias Score [1] |
RMSE Score [1] |
Seasonal Cycle Score [1] |
Spatial Distribution Score [1] |
Overall Score [1] |
|||
|---|---|---|---|---|---|---|---|---|---|---|---|---|---|---|---|---|
| Benchmark | [-] | 129. | ||||||||||||||
| CLM-CRUJRA | [-] | 142. | 142. | 129. | 127. | 12.8 | 25.5 | 0.397 | 0.761 | 0.705 | 0.968 | 0.995 | 0.827 | |||
| CLM-GSWP3 | [-] | 127. | 127. | 129. | 127. | -2.20 | 16.3 | 0.221 | 0.902 | 0.757 | 0.982 | 0.999 | 0.879 | |||
| CLM-Princeton | [-] | 128. | 128. | 129. | 127. | -1.56 | 14.3 | 0.257 | 0.873 | 0.803 | 0.977 | 0.998 | 0.891 | |||
| ISBA-CTRIP-CRUJRA | [-] | 141. | 141. | 129. | 117. | 11.8 | 24.7 | 0.367 | 0.766 | 0.715 | 0.971 | 0.996 | 0.833 | |||
| ISBA-CTRIP-GSWP3 | [-] | 126. | 126. | 129. | 117. | -2.82 | 16.7 | 0.216 | 0.889 | 0.758 | 0.981 | 0.999 | 0.877 | |||
| ISBA-CTRIP-Princeton | [-] | 127. | 127. | 129. | 117. | -1.80 | 14.6 | 0.259 | 0.866 | 0.803 | 0.976 | 0.997 | 0.889 | |||
| Mean-CRUJRA | [-] | 141. | 142. | 129. | 117. | 12.9 | 24.2 | 0.380 | 0.762 | 0.723 | 0.970 | 0.994 | 0.834 | |||
| Mean-GSWP3 | [-] | 126. | 127. | 129. | 117. | -2.51 | 15.3 | 0.200 | 0.912 | 0.768 | 0.982 | 0.999 | 0.886 | |||
| Mean-Princeton | [-] | 128. | 128. | 129. | 117. | -1.01 | 13.1 | 0.233 | 0.883 | 0.818 | 0.980 | 0.999 | 0.900 |
Download Data |
Period Mean (original grids) [Watt m-2] |
Model Period Mean (intersection) [Watt m-2] |
Benchmark Period Mean (intersection) [Watt m-2] |
Model Period Mean (complement) [Watt m-2] |
Benchmark Period Mean (complement) [Watt m-2] |
Bias [Watt m-2] |
RMSE [Watt m-2] |
Phase Shift [months] |
Bias Score [1] |
RMSE Score [1] |
Seasonal Cycle Score [1] |
Spatial Distribution Score [1] |
Overall Score [1] |
|||
|---|---|---|---|---|---|---|---|---|---|---|---|---|---|---|---|---|
| Benchmark | [-] | 172. | ||||||||||||||
| CLM-CRUJRA | [-] | 184. | 183. | 169. | 201. | 13.4 | 24.3 | 1.46 | 0.513 | 0.427 | 0.789 | 0.837 | 0.598 | |||
| CLM-GSWP3 | [-] | 171. | 171. | 169. | 201. | 1.31 | 17.4 | 0.658 | 0.754 | 0.457 | 0.908 | 0.922 | 0.700 | |||
| CLM-Princeton | [-] | 168. | 167. | 169. | 201. | -2.58 | 14.6 | 0.791 | 0.703 | 0.569 | 0.889 | 0.902 | 0.727 | |||
| ISBA-CTRIP-CRUJRA | [-] | 182. | 182. | 171. | 209. | 11.0 | 24.0 | 1.47 | 0.527 | 0.430 | 0.787 | 0.723 | 0.579 | |||
| ISBA-CTRIP-GSWP3 | [-] | 170. | 171. | 171. | 209. | -0.458 | 18.1 | 0.711 | 0.749 | 0.456 | 0.899 | 0.892 | 0.690 | |||
| ISBA-CTRIP-Princeton | [-] | 167. | 167. | 171. | 209. | -3.70 | 15.9 | 0.902 | 0.683 | 0.561 | 0.871 | 0.858 | 0.707 | |||
| Mean-CRUJRA | [-] | 183. | 183. | 171. | 212. | 11.4 | 24.1 | 1.45 | 0.521 | 0.430 | 0.792 | 0.684 | 0.571 | |||
| Mean-GSWP3 | [-] | 171. | 171. | 171. | 212. | -0.250 | 17.2 | 0.581 | 0.767 | 0.469 | 0.921 | 0.866 | 0.698 | |||
| Mean-Princeton | [-] | 168. | 168. | 171. | 212. | -3.55 | 14.8 | 0.775 | 0.702 | 0.581 | 0.891 | 0.803 | 0.712 |
Download Data |
Period Mean (original grids) [Watt m-2] |
Model Period Mean (intersection) [Watt m-2] |
Benchmark Period Mean (intersection) [Watt m-2] |
Model Period Mean (complement) [Watt m-2] |
Benchmark Period Mean (complement) [Watt m-2] |
Bias [Watt m-2] |
RMSE [Watt m-2] |
Phase Shift [months] |
Bias Score [1] |
RMSE Score [1] |
Seasonal Cycle Score [1] |
Spatial Distribution Score [1] |
Overall Score [1] |
|||
|---|---|---|---|---|---|---|---|---|---|---|---|---|---|---|---|---|
| Benchmark | [-] | 185. | ||||||||||||||
| CLM-CRUJRA | [-] | 189. | 189. | 183. | 217. | 6.75 | 24.3 | 0.997 | 0.648 | 0.479 | 0.877 | 0.857 | 0.668 | |||
| CLM-GSWP3 | [-] | 185. | 185. | 183. | 217. | 2.52 | 17.6 | 0.400 | 0.780 | 0.545 | 0.954 | 0.987 | 0.762 | |||
| CLM-Princeton | [-] | 183. | 183. | 183. | 217. | 0.381 | 14.5 | 0.557 | 0.774 | 0.640 | 0.931 | 0.973 | 0.791 | |||
| ISBA-CTRIP-CRUJRA | [-] | 189. | 189. | 184. | 217. | 5.30 | 23.7 | 0.857 | 0.649 | 0.499 | 0.898 | 0.814 | 0.672 | |||
| ISBA-CTRIP-GSWP3 | [-] | 185. | 185. | 184. | 217. | 1.68 | 17.9 | 0.320 | 0.769 | 0.551 | 0.964 | 0.980 | 0.763 | |||
| ISBA-CTRIP-Princeton | [-] | 184. | 185. | 184. | 217. | 1.02 | 15.4 | 0.476 | 0.745 | 0.642 | 0.945 | 0.970 | 0.789 | |||
| Mean-CRUJRA | [-] | 189. | 189. | 184. | 215. | 4.76 | 23.8 | 0.911 | 0.654 | 0.491 | 0.891 | 0.783 | 0.662 | |||
| Mean-GSWP3 | [-] | 185. | 185. | 184. | 215. | 0.820 | 17.0 | 0.295 | 0.802 | 0.558 | 0.969 | 0.967 | 0.771 | |||
| Mean-Princeton | [-] | 184. | 184. | 184. | 215. | -0.0839 | 14.1 | 0.442 | 0.777 | 0.656 | 0.949 | 0.945 | 0.796 |
Download Data |
Period Mean (original grids) [Watt m-2] |
Model Period Mean (intersection) [Watt m-2] |
Benchmark Period Mean (intersection) [Watt m-2] |
Model Period Mean (complement) [Watt m-2] |
Benchmark Period Mean (complement) [Watt m-2] |
Bias [Watt m-2] |
RMSE [Watt m-2] |
Phase Shift [months] |
Bias Score [1] |
RMSE Score [1] |
Seasonal Cycle Score [1] |
Spatial Distribution Score [1] |
Overall Score [1] |
|||
|---|---|---|---|---|---|---|---|---|---|---|---|---|---|---|---|---|
| Benchmark | [-] | 76.0 | ||||||||||||||
| CLM-CRUJRA | [-] | 84.0 | 68.5 | 76.1 | 69.9 | -7.48 | 21.1 | 0.222 | 0.842 | 0.718 | 0.985 | 0.915 | 0.836 | |||
| CLM-GSWP3 | [-] | 90.4 | 65.1 | 76.1 | 69.9 | -10.9 | 19.4 | 0.180 | 0.828 | 0.740 | 0.988 | 0.943 | 0.847 | |||
| CLM-Princeton | [-] | 90.8 | 68.5 | 76.1 | 69.9 | -7.44 | 18.4 | 0.244 | 0.849 | 0.737 | 0.984 | 0.964 | 0.854 | |||
| ISBA-CTRIP-CRUJRA | [-] | 66.1 | 66.3 | 76.0 | 69.7 | -9.51 | 21.2 | 0.216 | 0.831 | 0.716 | 0.986 | 0.944 | 0.838 | |||
| ISBA-CTRIP-GSWP3 | [-] | 64.0 | 64.1 | 76.0 | 69.7 | -11.7 | 19.5 | 0.193 | 0.814 | 0.738 | 0.987 | 0.951 | 0.846 | |||
| ISBA-CTRIP-Princeton | [-] | 66.2 | 66.4 | 76.0 | 69.7 | -9.45 | 19.4 | 0.360 | 0.837 | 0.729 | 0.976 | 0.967 | 0.848 | |||
| Mean-CRUJRA | [-] | 68.8 | 69.2 | 76.0 | 65.8 | -6.75 | 19.5 | 0.205 | 0.852 | 0.732 | 0.986 | 0.919 | 0.845 | |||
| Mean-GSWP3 | [-] | 65.2 | 65.7 | 76.0 | 65.8 | -10.3 | 17.4 | 0.183 | 0.835 | 0.757 | 0.988 | 0.945 | 0.856 | |||
| Mean-Princeton | [-] | 68.4 | 68.9 | 76.0 | 65.8 | -7.05 | 17.8 | 0.315 | 0.857 | 0.741 | 0.979 | 0.957 | 0.855 |
Download Data |
Period Mean (original grids) [Watt m-2] |
Model Period Mean (intersection) [Watt m-2] |
Benchmark Period Mean (intersection) [Watt m-2] |
Model Period Mean (complement) [Watt m-2] |
Benchmark Period Mean (complement) [Watt m-2] |
Bias [Watt m-2] |
RMSE [Watt m-2] |
Phase Shift [months] |
Bias Score [1] |
RMSE Score [1] |
Seasonal Cycle Score [1] |
Spatial Distribution Score [1] |
Overall Score [1] |
|||
|---|---|---|---|---|---|---|---|---|---|---|---|---|---|---|---|---|
| Benchmark | [-] | 148. | ||||||||||||||
| CLM-CRUJRA | [-] | 154. | 154. | 147. | 174. | 6.42 | 23.6 | 0.457 | 0.796 | 0.729 | 0.967 | 0.967 | 0.838 | |||
| CLM-GSWP3 | [-] | 145. | 145. | 147. | 174. | -2.48 | 16.7 | 0.264 | 0.903 | 0.768 | 0.981 | 0.999 | 0.884 | |||
| CLM-Princeton | [-] | 146. | 146. | 147. | 174. | -1.29 | 15.5 | 0.337 | 0.879 | 0.801 | 0.972 | 0.999 | 0.890 | |||
| ISBA-CTRIP-CRUJRA | [-] | 152. | 151. | 148. | 163. | 3.76 | 24.9 | 0.392 | 0.796 | 0.719 | 0.972 | 0.981 | 0.837 | |||
| ISBA-CTRIP-GSWP3 | [-] | 144. | 143. | 148. | 163. | -4.44 | 18.1 | 0.158 | 0.880 | 0.761 | 0.988 | 0.999 | 0.878 | |||
| ISBA-CTRIP-Princeton | [-] | 147. | 146. | 148. | 163. | -2.04 | 16.3 | 0.239 | 0.871 | 0.795 | 0.979 | 0.998 | 0.888 | |||
| Mean-CRUJRA | [-] | 154. | 155. | 148. | 139. | 6.64 | 22.7 | 0.412 | 0.796 | 0.745 | 0.971 | 0.951 | 0.842 | |||
| Mean-GSWP3 | [-] | 144. | 145. | 148. | 139. | -2.90 | 15.5 | 0.167 | 0.914 | 0.782 | 0.987 | 0.999 | 0.893 | |||
| Mean-Princeton | [-] | 147. | 147. | 148. | 139. | -0.377 | 14.0 | 0.240 | 0.891 | 0.820 | 0.980 | 0.998 | 0.902 |
Temporally integrated period mean