Mean State
Download Data |
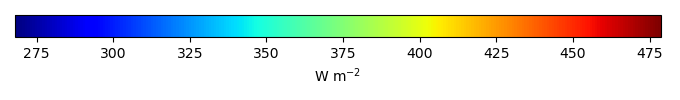
Period Mean (original grids) [W m-2] |
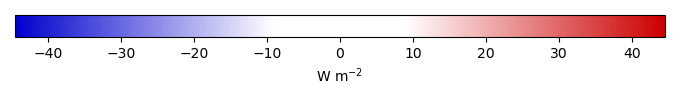
Bias [W m-2] |
RMSE [W m-2] |
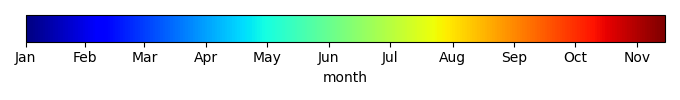
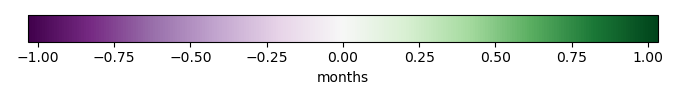
Phase Shift [months] |
Bias Score [1] |
RMSE Score [1] |
Seasonal Cycle Score [1] |
Overall Score [1] |
|||
|---|---|---|---|---|---|---|---|---|---|---|---|
| Benchmark | [-] | 321. | |||||||||
| CLM-CRUJRA | [-] | 319. | -1.88 | 7.52 | 0.207 | 0.939 | 0.857 | 0.986 | 0.910 | ||
| CLM-GSWP3 | [-] | 322. | 1.04 | 7.62 | 0.103 | 0.936 | 0.878 | 0.993 | 0.921 | ||
| CLM-Princeton | [-] | 323. | 1.46 | 7.59 | 0.103 | 0.940 | 0.869 | 0.993 | 0.918 | ||
| ISBA-CTRIP-CRUJRA | [-] | 317. | -4.75 | 7.50 | 0.00 | 0.901 | 0.861 | 1.00 | 0.906 | ||
| ISBA-CTRIP-GSWP3 | [-] | 317. | -4.70 | 7.28 | 0.00 | 0.890 | 0.881 | 1.00 | 0.913 | ||
| ISBA-CTRIP-Princeton | [-] | 317. | -4.48 | 7.65 | 0.00 | 0.891 | 0.868 | 1.00 | 0.907 | ||
| Mean-CRUJRA | [-] | 319. | -2.78 | 6.90 | 0.103 | 0.938 | 0.859 | 0.993 | 0.912 | ||
| Mean-GSWP3 | [-] | 320. | -1.22 | 6.30 | 0.00 | 0.952 | 0.881 | 1.00 | 0.928 | ||
| Mean-Princeton | [-] | 320. | -0.954 | 6.62 | 0.00 | 0.952 | 0.870 | 1.00 | 0.923 |
Download Data |
Period Mean (original grids) [W m-2] |
Bias [W m-2] |
RMSE [W m-2] |
Phase Shift [months] |
Bias Score [1] |
RMSE Score [1] |
Seasonal Cycle Score [1] |
Overall Score [1] |
|||
|---|---|---|---|---|---|---|---|---|---|---|---|
| Benchmark | [-] | 376. | |||||||||
| CLM-CRUJRA | [-] | 380. | 3.64 | 14.4 | 0.320 | 0.741 | 0.753 | 0.977 | 0.806 | ||
| CLM-GSWP3 | [-] | 383. | 7.19 | 15.7 | 0.361 | 0.733 | 0.753 | 0.972 | 0.803 | ||
| CLM-Princeton | [-] | 383. | 5.94 | 15.4 | 0.499 | 0.671 | 0.727 | 0.956 | 0.770 | ||
| ISBA-CTRIP-CRUJRA | [-] | 372. | -4.47 | 13.9 | 0.243 | 0.739 | 0.765 | 0.980 | 0.812 | ||
| ISBA-CTRIP-GSWP3 | [-] | 374. | -2.39 | 13.6 | 0.251 | 0.741 | 0.767 | 0.981 | 0.814 | ||
| ISBA-CTRIP-Princeton | [-] | 375. | -2.76 | 13.6 | 0.402 | 0.668 | 0.733 | 0.963 | 0.774 | ||
| Mean-CRUJRA | [-] | 375. | -1.26 | 13.8 | 0.303 | 0.748 | 0.758 | 0.978 | 0.810 | ||
| Mean-GSWP3 | [-] | 378. | 1.79 | 13.9 | 0.303 | 0.751 | 0.758 | 0.978 | 0.811 | ||
| Mean-Princeton | [-] | 378. | 0.710 | 13.8 | 0.414 | 0.673 | 0.731 | 0.962 | 0.774 |
Download Data |
Period Mean (original grids) [W m-2] |
Bias [W m-2] |
RMSE [W m-2] |
Phase Shift [months] |
Bias Score [1] |
RMSE Score [1] |
Seasonal Cycle Score [1] |
Overall Score [1] |
|||
|---|---|---|---|---|---|---|---|---|---|---|---|
| Benchmark | [-] | 429. | |||||||||
| CLM-CRUJRA | [-] | 433. | 5.79 | 14.6 | 0.00 | 0.775 | 0.719 | 1.00 | 0.803 | ||
| CLM-GSWP3 | [-] | 438. | 10.8 | 18.8 | 0.00 | 0.709 | 0.714 | 1.00 | 0.784 | ||
| CLM-Princeton | [-] | 435. | 6.56 | 18.4 | 0.207 | 0.569 | 0.619 | 0.986 | 0.698 | ||
| ISBA-CTRIP-CRUJRA | [-] | 423. | -3.75 | 10.2 | 0.164 | 0.842 | 0.747 | 0.989 | 0.832 | ||
| ISBA-CTRIP-GSWP3 | [-] | 426. | -1.21 | 10.4 | 0.164 | 0.829 | 0.733 | 0.989 | 0.821 | ||
| ISBA-CTRIP-Princeton | [-] | 425. | -2.43 | 11.3 | 0.403 | 0.613 | 0.629 | 0.973 | 0.711 | ||
| Mean-CRUJRA | [-] | 426. | -1.12 | 11.3 | 0.164 | 0.825 | 0.744 | 0.989 | 0.826 | ||
| Mean-GSWP3 | [-] | 430. | 2.73 | 13.1 | 0.164 | 0.804 | 0.723 | 0.989 | 0.810 | ||
| Mean-Princeton | [-] | 428. | 0.00688 | 13.4 | 0.207 | 0.605 | 0.635 | 0.986 | 0.715 |
Download Data |
Period Mean (original grids) [W m-2] |
Bias [W m-2] |
RMSE [W m-2] |
Phase Shift [months] |
Bias Score [1] |
RMSE Score [1] |
Seasonal Cycle Score [1] |
Overall Score [1] |
|||
|---|---|---|---|---|---|---|---|---|---|---|---|
| Benchmark | [-] | 426. | |||||||||
| CLM-CRUJRA | [-] | 414. | -5.26 | 12.2 | 0.847 | 0.888 | 0.794 | 0.944 | 0.855 | ||
| CLM-GSWP3 | [-] | 426. | 5.96 | 12.7 | 0.847 | 0.866 | 0.817 | 0.944 | 0.861 | ||
| CLM-Princeton | [-] | 426. | 0.618 | 10.9 | 0.681 | 0.705 | 0.703 | 0.955 | 0.766 | ||
| ISBA-CTRIP-CRUJRA | [-] | 404. | -16.1 | 16.6 | 0.508 | 0.712 | 0.810 | 0.966 | 0.825 | ||
| ISBA-CTRIP-GSWP3 | [-] | 409. | -11.1 | 13.3 | 0.847 | 0.793 | 0.813 | 0.944 | 0.841 | ||
| ISBA-CTRIP-Princeton | [-] | 411. | -15.2 | 10.7 | 1.02 | 0.681 | 0.697 | 0.932 | 0.752 | ||
| Mean-CRUJRA | [-] | 409. | -10.6 | 13.4 | 0.847 | 0.803 | 0.817 | 0.944 | 0.845 | ||
| Mean-GSWP3 | [-] | 416. | -3.15 | 10.1 | 0.847 | 0.909 | 0.829 | 0.944 | 0.878 | ||
| Mean-Princeton | [-] | 418. | -8.10 | 8.11 | 1.02 | 0.751 | 0.709 | 0.932 | 0.776 |
Download Data |
Period Mean (original grids) [W m-2] |
Bias [W m-2] |
RMSE [W m-2] |
Phase Shift [months] |
Bias Score [1] |
RMSE Score [1] |
Seasonal Cycle Score [1] |
Overall Score [1] |
|||
|---|---|---|---|---|---|---|---|---|---|---|---|
| Benchmark | [-] | 359. | |||||||||
| CLM-CRUJRA | [-] | 358. | 1.54 | 12.0 | 0.246 | 0.816 | 0.805 | 0.983 | 0.852 | ||
| CLM-GSWP3 | [-] | 362. | 4.89 | 13.0 | 0.270 | 0.825 | 0.795 | 0.982 | 0.849 | ||
| CLM-Princeton | [-] | 361. | 2.71 | 12.7 | 0.388 | 0.763 | 0.773 | 0.974 | 0.821 | ||
| ISBA-CTRIP-CRUJRA | [-] | 353. | -4.28 | 12.0 | 0.147 | 0.788 | 0.811 | 0.990 | 0.850 | ||
| ISBA-CTRIP-GSWP3 | [-] | 354. | -2.92 | 11.6 | 0.123 | 0.796 | 0.811 | 0.992 | 0.853 | ||
| ISBA-CTRIP-Princeton | [-] | 355. | -3.88 | 12.4 | 0.207 | 0.727 | 0.779 | 0.986 | 0.818 | ||
| Mean-CRUJRA | [-] | 354. | -2.46 | 11.5 | 0.176 | 0.806 | 0.808 | 0.988 | 0.853 | ||
| Mean-GSWP3 | [-] | 356. | 0.0169 | 11.6 | 0.151 | 0.824 | 0.805 | 0.990 | 0.856 | ||
| Mean-Princeton | [-] | 356. | -1.92 | 12.0 | 0.238 | 0.752 | 0.773 | 0.984 | 0.821 |
Download Data |
Period Mean (original grids) [W m-2] |
Bias [W m-2] |
RMSE [W m-2] |
Phase Shift [months] |
Bias Score [1] |
RMSE Score [1] |
Seasonal Cycle Score [1] |
Overall Score [1] |
|||
|---|---|---|---|---|---|---|---|---|---|---|---|
| Benchmark | [-] | 451. | |||||||||
| CLM-CRUJRA | [-] | 466. | 14.7 | 18.0 | 0.364 | 0.376 | 0.565 | 0.967 | 0.618 | ||
| CLM-GSWP3 | [-] | 471. | 19.9 | 21.6 | 0.364 | 0.329 | 0.535 | 0.954 | 0.588 | ||
| CLM-Princeton | [-] | 471. | 20.3 | 22.0 | 0.858 | 0.342 | 0.526 | 0.897 | 0.573 | ||
| ISBA-CTRIP-CRUJRA | [-] | 457. | 8.38 | 16.1 | 0.408 | 0.512 | 0.577 | 0.953 | 0.655 | ||
| ISBA-CTRIP-GSWP3 | [-] | 460. | 10.9 | 17.3 | 0.408 | 0.472 | 0.564 | 0.965 | 0.641 | ||
| ISBA-CTRIP-Princeton | [-] | 461. | 11.4 | 17.1 | 0.858 | 0.444 | 0.513 | 0.897 | 0.592 | ||
| Mean-CRUJRA | [-] | 461. | 12.6 | 16.8 | 0.544 | 0.427 | 0.563 | 0.956 | 0.627 | ||
| Mean-GSWP3 | [-] | 465. | 16.7 | 19.7 | 0.408 | 0.343 | 0.537 | 0.965 | 0.596 | ||
| Mean-Princeton | [-] | 465. | 16.8 | 19.5 | 0.858 | 0.322 | 0.525 | 0.897 | 0.567 |
Download Data |
Period Mean (original grids) [W m-2] |
Bias [W m-2] |
RMSE [W m-2] |
Phase Shift [months] |
Bias Score [1] |
RMSE Score [1] |
Seasonal Cycle Score [1] |
Overall Score [1] |
|||
|---|---|---|---|---|---|---|---|---|---|---|---|
| Benchmark | [-] | 286. | |||||||||
| CLM-CRUJRA | [-] | 274. | -17.8 | 13.6 | 0.207 | 0.680 | 0.684 | 0.986 | 0.758 | ||
| CLM-GSWP3 | [-] | 279. | -12.8 | 14.4 | 0.207 | 0.664 | 0.693 | 0.986 | 0.759 | ||
| CLM-Princeton | [-] | 281. | -4.99 | 11.4 | 0.817 | 0.710 | 0.690 | 0.849 | 0.735 | ||
| ISBA-CTRIP-CRUJRA | [-] | 265. | -27.4 | 19.5 | 0.00 | 0.646 | 0.671 | 1.00 | 0.747 | ||
| ISBA-CTRIP-GSWP3 | [-] | 274. | -17.9 | 16.1 | 0.00 | 0.672 | 0.688 | 1.00 | 0.762 | ||
| ISBA-CTRIP-Princeton | [-] | 276. | -10.6 | 10.8 | 0.817 | 0.756 | 0.691 | 0.849 | 0.747 | ||
| Mean-CRUJRA | [-] | 267. | -24.8 | 17.9 | 0.00 | 0.697 | 0.686 | 1.00 | 0.767 | ||
| Mean-GSWP3 | [-] | 276. | -16.3 | 16.0 | 0.00 | 0.669 | 0.695 | 1.00 | 0.765 | ||
| Mean-Princeton | [-] | 277. | -8.92 | 11.5 | 0.817 | 0.740 | 0.690 | 0.849 | 0.742 |
Download Data |
Period Mean (original grids) [W m-2] |
Bias [W m-2] |
RMSE [W m-2] |
Phase Shift [months] |
Bias Score [1] |
RMSE Score [1] |
Seasonal Cycle Score [1] |
Overall Score [1] |
|||
|---|---|---|---|---|---|---|---|---|---|---|---|
| Benchmark | [-] | 377. | |||||||||
| CLM-CRUJRA | [-] | 384. | 6.87 | 17.5 | 0.405 | 0.725 | 0.746 | 0.970 | 0.797 | ||
| CLM-GSWP3 | [-] | 386. | 8.88 | 18.2 | 0.501 | 0.718 | 0.756 | 0.964 | 0.798 | ||
| CLM-Princeton | [-] | 386. | 7.99 | 18.8 | 0.553 | 0.632 | 0.731 | 0.960 | 0.763 | ||
| ISBA-CTRIP-CRUJRA | [-] | 372. | -4.92 | 16.1 | 0.333 | 0.735 | 0.768 | 0.973 | 0.811 | ||
| ISBA-CTRIP-GSWP3 | [-] | 374. | -2.80 | 16.0 | 0.333 | 0.733 | 0.772 | 0.973 | 0.813 | ||
| ISBA-CTRIP-Princeton | [-] | 375. | -2.74 | 16.2 | 0.394 | 0.636 | 0.747 | 0.971 | 0.775 | ||
| Mean-CRUJRA | [-] | 377. | -0.551 | 16.4 | 0.357 | 0.753 | 0.754 | 0.973 | 0.809 | ||
| Mean-GSWP3 | [-] | 379. | 1.90 | 16.2 | 0.453 | 0.755 | 0.763 | 0.967 | 0.812 | ||
| Mean-Princeton | [-] | 379. | 1.33 | 16.6 | 0.420 | 0.647 | 0.741 | 0.969 | 0.774 |
Temporally integrated period mean