Mean State
Download Data |
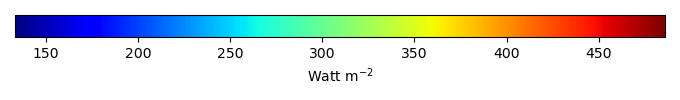
Period Mean (original grids) [Watt m-2] |
Model Period Mean (intersection) [Watt m-2] |
Benchmark Period Mean (intersection) [Watt m-2] |
Model Period Mean (complement) [Watt m-2] |
Benchmark Period Mean (complement) [Watt m-2] |
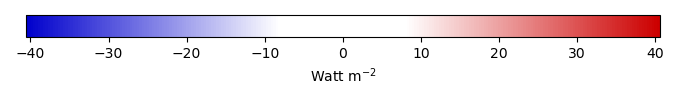
Bias [Watt m-2] |
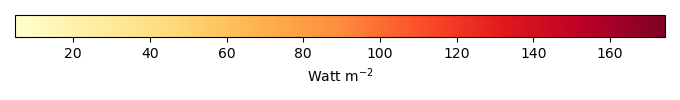
RMSE [Watt m-2] |
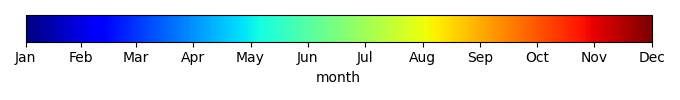
Phase Shift [months] |
Bias Score [1] |
RMSE Score [1] |
Seasonal Cycle Score [1] |
Spatial Distribution Score [1] |
Overall Score [1] |
|||
|---|---|---|---|---|---|---|---|---|---|---|---|---|---|---|---|---|
| Benchmark | [-] | 307. | ||||||||||||||
| CLM-CRUJRA | [-] | 310. | 310. | 306. | 321. | 4.17 | 13.7 | 0.0818 | 0.864 | 0.832 | 0.994 | 0.999 | 0.904 | |||
| CLM-GSWP3 | [-] | 316. | 316. | 306. | 321. | 10.3 | 15.5 | 0.0645 | 0.826 | 0.833 | 0.996 | 0.995 | 0.897 | |||
| CLM-Princeton | [-] | 315. | 316. | 306. | 321. | 9.39 | 15.1 | 0.0689 | 0.830 | 0.840 | 0.995 | 0.985 | 0.898 | |||
| ISBA-CTRIP-CRUJRA | [-] | 304. | 305. | 306. | 328. | -1.68 | 14.3 | 0.0797 | 0.862 | 0.823 | 0.994 | 0.992 | 0.899 | |||
| ISBA-CTRIP-GSWP3 | [-] | 309. | 310. | 306. | 328. | 3.33 | 12.8 | 0.0765 | 0.880 | 0.832 | 0.995 | 0.999 | 0.907 | |||
| ISBA-CTRIP-Princeton | [-] | 310. | 310. | 306. | 328. | 3.68 | 13.0 | 0.0756 | 0.868 | 0.837 | 0.995 | 0.996 | 0.907 | |||
| Mean-CRUJRA | [-] | 306. | 307. | 306. | 337. | 0.716 | 13.1 | 0.0822 | 0.873 | 0.831 | 0.994 | 0.998 | 0.905 | |||
| Mean-GSWP3 | [-] | 312. | 313. | 306. | 337. | 6.29 | 13.1 | 0.0665 | 0.871 | 0.836 | 0.995 | 0.987 | 0.905 | |||
| Mean-Princeton | [-] | 311. | 312. | 306. | 337. | 6.04 | 13.2 | 0.0698 | 0.861 | 0.840 | 0.995 | 0.970 | 0.901 |
Download Data |
Period Mean (original grids) [Watt m-2] |
Model Period Mean (intersection) [Watt m-2] |
Benchmark Period Mean (intersection) [Watt m-2] |
Model Period Mean (complement) [Watt m-2] |
Benchmark Period Mean (complement) [Watt m-2] |
Bias [Watt m-2] |
RMSE [Watt m-2] |
Phase Shift [months] |
Bias Score [1] |
RMSE Score [1] |
Seasonal Cycle Score [1] |
Spatial Distribution Score [1] |
Overall Score [1] |
|||
|---|---|---|---|---|---|---|---|---|---|---|---|---|---|---|---|---|
| Benchmark | [-] | 397. | ||||||||||||||
| CLM-CRUJRA | [-] | 403. | 394. | 396. | 415. | -2.00 | 16.8 | 0.597 | 0.738 | 0.670 | 0.932 | 0.998 | 0.801 | |||
| CLM-GSWP3 | [-] | 409. | 400. | 396. | 415. | 3.73 | 16.2 | 0.523 | 0.710 | 0.684 | 0.941 | 0.998 | 0.804 | |||
| CLM-Princeton | [-] | 408. | 400. | 396. | 415. | 3.42 | 16.6 | 0.575 | 0.707 | 0.681 | 0.932 | 0.997 | 0.799 | |||
| ISBA-CTRIP-CRUJRA | [-] | 387. | 386. | 397. | 428. | -10.0 | 18.3 | 0.492 | 0.698 | 0.680 | 0.945 | 0.997 | 0.800 | |||
| ISBA-CTRIP-GSWP3 | [-] | 391. | 391. | 397. | 428. | -5.48 | 16.4 | 0.481 | 0.728 | 0.684 | 0.946 | 0.994 | 0.807 | |||
| ISBA-CTRIP-Princeton | [-] | 392. | 392. | 397. | 428. | -4.44 | 16.5 | 0.508 | 0.720 | 0.684 | 0.941 | 0.994 | 0.804 | |||
| Mean-CRUJRA | [-] | 390. | 390. | 397. | 438. | -6.14 | 16.3 | 0.531 | 0.741 | 0.676 | 0.941 | 0.998 | 0.806 | |||
| Mean-GSWP3 | [-] | 396. | 396. | 397. | 438. | -1.06 | 15.0 | 0.491 | 0.746 | 0.687 | 0.945 | 0.996 | 0.812 | |||
| Mean-Princeton | [-] | 396. | 396. | 397. | 438. | -0.651 | 15.4 | 0.532 | 0.734 | 0.683 | 0.938 | 0.996 | 0.807 |
Download Data |
Period Mean (original grids) [Watt m-2] |
Model Period Mean (intersection) [Watt m-2] |
Benchmark Period Mean (intersection) [Watt m-2] |
Model Period Mean (complement) [Watt m-2] |
Benchmark Period Mean (complement) [Watt m-2] |
Bias [Watt m-2] |
RMSE [Watt m-2] |
Phase Shift [months] |
Bias Score [1] |
RMSE Score [1] |
Seasonal Cycle Score [1] |
Spatial Distribution Score [1] |
Overall Score [1] |
|||
|---|---|---|---|---|---|---|---|---|---|---|---|---|---|---|---|---|
| Benchmark | [-] | 469. | ||||||||||||||
| CLM-CRUJRA | [-] | 454. | 453. | 470. | 447. | -16.4 | 25.9 | 0.616 | 0.652 | 0.663 | 0.942 | 0.990 | 0.782 | |||
| CLM-GSWP3 | [-] | 461. | 461. | 470. | 447. | -9.17 | 21.2 | 0.529 | 0.717 | 0.683 | 0.951 | 0.992 | 0.805 | |||
| CLM-Princeton | [-] | 460. | 460. | 470. | 447. | -9.82 | 21.8 | 0.560 | 0.705 | 0.681 | 0.947 | 0.989 | 0.801 | |||
| ISBA-CTRIP-CRUJRA | [-] | 443. | 443. | 469. | 455. | -27.0 | 32.1 | 0.587 | 0.535 | 0.671 | 0.947 | 0.987 | 0.762 | |||
| ISBA-CTRIP-GSWP3 | [-] | 448. | 448. | 469. | 455. | -22.0 | 28.1 | 0.545 | 0.603 | 0.676 | 0.950 | 0.990 | 0.779 | |||
| ISBA-CTRIP-Princeton | [-] | 449. | 448. | 469. | 455. | -21.1 | 27.6 | 0.560 | 0.610 | 0.679 | 0.948 | 0.992 | 0.782 | |||
| Mean-CRUJRA | [-] | 448. | 448. | 469. | 471. | -21.6 | 28.3 | 0.605 | 0.599 | 0.668 | 0.944 | 0.985 | 0.773 | |||
| Mean-GSWP3 | [-] | 454. | 454. | 469. | 471. | -15.6 | 23.6 | 0.530 | 0.679 | 0.681 | 0.952 | 0.988 | 0.796 | |||
| Mean-Princeton | [-] | 454. | 454. | 469. | 471. | -15.4 | 23.8 | 0.555 | 0.669 | 0.682 | 0.947 | 0.987 | 0.794 |
Download Data |
Period Mean (original grids) [Watt m-2] |
Model Period Mean (intersection) [Watt m-2] |
Benchmark Period Mean (intersection) [Watt m-2] |
Model Period Mean (complement) [Watt m-2] |
Benchmark Period Mean (complement) [Watt m-2] |
Bias [Watt m-2] |
RMSE [Watt m-2] |
Phase Shift [months] |
Bias Score [1] |
RMSE Score [1] |
Seasonal Cycle Score [1] |
Spatial Distribution Score [1] |
Overall Score [1] |
|||
|---|---|---|---|---|---|---|---|---|---|---|---|---|---|---|---|---|
| Benchmark | [-] | 382. | ||||||||||||||
| CLM-CRUJRA | [-] | 374. | 374. | 382. | 403. | -7.16 | 21.3 | 0.126 | 0.830 | 0.773 | 0.988 | 0.992 | 0.871 | |||
| CLM-GSWP3 | [-] | 381. | 381. | 382. | 403. | -0.857 | 18.6 | 0.0926 | 0.858 | 0.786 | 0.992 | 0.966 | 0.878 | |||
| CLM-Princeton | [-] | 380. | 380. | 382. | 403. | -2.01 | 19.1 | 0.0979 | 0.846 | 0.789 | 0.991 | 0.989 | 0.881 | |||
| ISBA-CTRIP-CRUJRA | [-] | 363. | 363. | 382. | 401. | -18.5 | 25.9 | 0.104 | 0.741 | 0.782 | 0.990 | 0.999 | 0.859 | |||
| ISBA-CTRIP-GSWP3 | [-] | 370. | 370. | 382. | 401. | -11.9 | 21.3 | 0.0881 | 0.801 | 0.791 | 0.992 | 0.987 | 0.872 | |||
| ISBA-CTRIP-Princeton | [-] | 370. | 370. | 382. | 401. | -11.8 | 22.1 | 0.0913 | 0.795 | 0.790 | 0.991 | 0.997 | 0.873 | |||
| Mean-CRUJRA | [-] | 368. | 368. | 382. | 413. | -13.1 | 22.0 | 0.110 | 0.803 | 0.782 | 0.989 | 0.996 | 0.871 | |||
| Mean-GSWP3 | [-] | 374. | 375. | 382. | 413. | -6.63 | 18.1 | 0.0755 | 0.859 | 0.794 | 0.994 | 0.974 | 0.883 | |||
| Mean-Princeton | [-] | 374. | 374. | 382. | 413. | -7.13 | 18.8 | 0.0818 | 0.848 | 0.794 | 0.993 | 0.991 | 0.884 |
Download Data |
Period Mean (original grids) [Watt m-2] |
Model Period Mean (intersection) [Watt m-2] |
Benchmark Period Mean (intersection) [Watt m-2] |
Model Period Mean (complement) [Watt m-2] |
Benchmark Period Mean (complement) [Watt m-2] |
Bias [Watt m-2] |
RMSE [Watt m-2] |
Phase Shift [months] |
Bias Score [1] |
RMSE Score [1] |
Seasonal Cycle Score [1] |
Spatial Distribution Score [1] |
Overall Score [1] |
|||
|---|---|---|---|---|---|---|---|---|---|---|---|---|---|---|---|---|
| Benchmark | [-] | 368. | ||||||||||||||
| CLM-CRUJRA | [-] | 362. | 368. | 368. | 367. | -0.227 | 17.3 | 0.971 | 0.564 | 0.607 | 0.875 | 0.993 | 0.729 | |||
| CLM-GSWP3 | [-] | 364. | 371. | 368. | 367. | 3.25 | 16.0 | 0.863 | 0.587 | 0.618 | 0.890 | 0.998 | 0.742 | |||
| CLM-Princeton | [-] | 365. | 372. | 368. | 367. | 4.55 | 17.2 | 0.848 | 0.567 | 0.615 | 0.893 | 0.998 | 0.737 | |||
| ISBA-CTRIP-CRUJRA | [-] | 356. | 364. | 368. | 361. | -4.43 | 15.1 | 1.08 | 0.578 | 0.613 | 0.848 | 0.985 | 0.727 | |||
| ISBA-CTRIP-GSWP3 | [-] | 357. | 364. | 368. | 361. | -3.99 | 16.4 | 0.745 | 0.559 | 0.609 | 0.905 | 0.999 | 0.736 | |||
| ISBA-CTRIP-Princeton | [-] | 359. | 366. | 368. | 361. | -1.88 | 16.6 | 0.812 | 0.556 | 0.615 | 0.896 | 0.996 | 0.736 | |||
| Mean-CRUJRA | [-] | 364. | 364. | 368. | 362. | -4.78 | 14.1 | 1.13 | 0.613 | 0.616 | 0.843 | 0.964 | 0.730 | |||
| Mean-GSWP3 | [-] | 367. | 366. | 368. | 362. | -1.94 | 12.7 | 0.640 | 0.637 | 0.622 | 0.929 | 0.992 | 0.760 | |||
| Mean-Princeton | [-] | 369. | 368. | 368. | 362. | -0.433 | 13.3 | 0.849 | 0.622 | 0.622 | 0.893 | 0.984 | 0.749 |
Download Data |
Period Mean (original grids) [Watt m-2] |
Model Period Mean (intersection) [Watt m-2] |
Benchmark Period Mean (intersection) [Watt m-2] |
Model Period Mean (complement) [Watt m-2] |
Benchmark Period Mean (complement) [Watt m-2] |
Bias [Watt m-2] |
RMSE [Watt m-2] |
Phase Shift [months] |
Bias Score [1] |
RMSE Score [1] |
Seasonal Cycle Score [1] |
Spatial Distribution Score [1] |
Overall Score [1] |
|||
|---|---|---|---|---|---|---|---|---|---|---|---|---|---|---|---|---|
| Benchmark | [-] | 360. | ||||||||||||||
| CLM-CRUJRA | [-] | 362. | 363. | 360. | 362. | 3.26 | 12.4 | 0.314 | 0.828 | 0.804 | 0.974 | 0.993 | 0.881 | |||
| CLM-GSWP3 | [-] | 366. | 366. | 360. | 362. | 6.50 | 12.8 | 0.258 | 0.813 | 0.812 | 0.980 | 0.994 | 0.882 | |||
| CLM-Princeton | [-] | 366. | 366. | 360. | 362. | 6.51 | 13.0 | 0.267 | 0.806 | 0.815 | 0.979 | 0.994 | 0.882 | |||
| ISBA-CTRIP-CRUJRA | [-] | 356. | 357. | 360. | 363. | -2.76 | 11.9 | 0.200 | 0.832 | 0.807 | 0.983 | 0.991 | 0.884 | |||
| ISBA-CTRIP-GSWP3 | [-] | 358. | 359. | 360. | 363. | -0.264 | 11.4 | 0.188 | 0.848 | 0.807 | 0.984 | 0.993 | 0.888 | |||
| ISBA-CTRIP-Princeton | [-] | 359. | 360. | 360. | 363. | 0.429 | 11.4 | 0.180 | 0.842 | 0.811 | 0.984 | 0.994 | 0.889 | |||
| Mean-CRUJRA | [-] | 358. | 359. | 360. | 368. | -0.286 | 10.9 | 0.238 | 0.857 | 0.810 | 0.980 | 0.989 | 0.889 | |||
| Mean-GSWP3 | [-] | 361. | 362. | 360. | 368. | 2.62 | 10.8 | 0.207 | 0.860 | 0.814 | 0.984 | 0.991 | 0.893 | |||
| Mean-Princeton | [-] | 361. | 363. | 360. | 368. | 2.94 | 11.0 | 0.201 | 0.847 | 0.818 | 0.983 | 0.991 | 0.891 |
Download Data |
Period Mean (original grids) [Watt m-2] |
Model Period Mean (intersection) [Watt m-2] |
Benchmark Period Mean (intersection) [Watt m-2] |
Model Period Mean (complement) [Watt m-2] |
Benchmark Period Mean (complement) [Watt m-2] |
Bias [Watt m-2] |
RMSE [Watt m-2] |
Phase Shift [months] |
Bias Score [1] |
RMSE Score [1] |
Seasonal Cycle Score [1] |
Spatial Distribution Score [1] |
Overall Score [1] |
|||
|---|---|---|---|---|---|---|---|---|---|---|---|---|---|---|---|---|
| Benchmark | [-] | 450. | ||||||||||||||
| CLM-CRUJRA | [-] | 452. | 451. | 449. | 467. | 2.60 | 11.2 | 2.10 | 0.464 | 0.400 | 0.656 | 0.964 | 0.577 | |||
| CLM-GSWP3 | [-] | 456. | 456. | 449. | 467. | 6.83 | 12.1 | 1.96 | 0.413 | 0.404 | 0.684 | 0.999 | 0.581 | |||
| CLM-Princeton | [-] | 457. | 457. | 449. | 467. | 8.14 | 13.0 | 2.05 | 0.382 | 0.399 | 0.668 | 0.996 | 0.569 | |||
| ISBA-CTRIP-CRUJRA | [-] | 448. | 449. | 450. | 468. | -1.06 | 10.6 | 1.96 | 0.483 | 0.411 | 0.683 | 0.999 | 0.597 | |||
| ISBA-CTRIP-GSWP3 | [-] | 450. | 450. | 450. | 468. | 0.392 | 11.4 | 2.08 | 0.461 | 0.399 | 0.662 | 0.992 | 0.583 | |||
| ISBA-CTRIP-Princeton | [-] | 452. | 452. | 450. | 468. | 2.30 | 12.0 | 2.16 | 0.438 | 0.401 | 0.647 | 0.987 | 0.575 | |||
| Mean-CRUJRA | [-] | 450. | 450. | 450. | 469. | 0.367 | 9.94 | 1.96 | 0.510 | 0.410 | 0.681 | 0.999 | 0.602 | |||
| Mean-GSWP3 | [-] | 453. | 453. | 450. | 469. | 3.19 | 10.8 | 1.92 | 0.461 | 0.407 | 0.690 | 0.991 | 0.591 | |||
| Mean-Princeton | [-] | 454. | 455. | 450. | 469. | 4.73 | 11.5 | 2.01 | 0.432 | 0.403 | 0.675 | 0.995 | 0.581 |
Download Data |
Period Mean (original grids) [Watt m-2] |
Model Period Mean (intersection) [Watt m-2] |
Benchmark Period Mean (intersection) [Watt m-2] |
Model Period Mean (complement) [Watt m-2] |
Benchmark Period Mean (complement) [Watt m-2] |
Bias [Watt m-2] |
RMSE [Watt m-2] |
Phase Shift [months] |
Bias Score [1] |
RMSE Score [1] |
Seasonal Cycle Score [1] |
Spatial Distribution Score [1] |
Overall Score [1] |
|||
|---|---|---|---|---|---|---|---|---|---|---|---|---|---|---|---|---|
| Benchmark | [-] | 449. | ||||||||||||||
| CLM-CRUJRA | [-] | 452. | 452. | 449. | 459. | 3.22 | 14.3 | 1.16 | 0.624 | 0.463 | 0.858 | 0.974 | 0.677 | |||
| CLM-GSWP3 | [-] | 459. | 458. | 449. | 459. | 9.49 | 15.9 | 1.02 | 0.497 | 0.483 | 0.874 | 0.985 | 0.664 | |||
| CLM-Princeton | [-] | 458. | 458. | 449. | 459. | 8.91 | 16.0 | 1.20 | 0.510 | 0.468 | 0.847 | 0.990 | 0.657 | |||
| ISBA-CTRIP-CRUJRA | [-] | 445. | 445. | 449. | 460. | -4.40 | 13.0 | 0.849 | 0.625 | 0.507 | 0.905 | 0.987 | 0.706 | |||
| ISBA-CTRIP-GSWP3 | [-] | 449. | 449. | 449. | 460. | -0.608 | 12.8 | 0.849 | 0.634 | 0.497 | 0.902 | 0.992 | 0.704 | |||
| ISBA-CTRIP-Princeton | [-] | 450. | 450. | 449. | 460. | 0.805 | 13.3 | 0.948 | 0.605 | 0.491 | 0.885 | 0.991 | 0.692 | |||
| Mean-CRUJRA | [-] | 448. | 448. | 449. | 461. | -0.748 | 12.3 | 0.934 | 0.671 | 0.494 | 0.895 | 0.990 | 0.709 | |||
| Mean-GSWP3 | [-] | 453. | 453. | 449. | 461. | 4.19 | 12.8 | 0.904 | 0.606 | 0.499 | 0.894 | 0.996 | 0.699 | |||
| Mean-Princeton | [-] | 454. | 454. | 449. | 461. | 4.64 | 13.4 | 1.04 | 0.590 | 0.487 | 0.873 | 0.997 | 0.687 |
Download Data |
Period Mean (original grids) [Watt m-2] |
Model Period Mean (intersection) [Watt m-2] |
Benchmark Period Mean (intersection) [Watt m-2] |
Model Period Mean (complement) [Watt m-2] |
Benchmark Period Mean (complement) [Watt m-2] |
Bias [Watt m-2] |
RMSE [Watt m-2] |
Phase Shift [months] |
Bias Score [1] |
RMSE Score [1] |
Seasonal Cycle Score [1] |
Spatial Distribution Score [1] |
Overall Score [1] |
|||
|---|---|---|---|---|---|---|---|---|---|---|---|---|---|---|---|---|
| Benchmark | [-] | 265. | ||||||||||||||
| CLM-CRUJRA | [-] | 255. | 266. | 265. | 262. | 0.822 | 14.2 | 0.0209 | 0.909 | 0.813 | 0.999 | 0.998 | 0.906 | |||
| CLM-GSWP3 | [-] | 263. | 272. | 265. | 262. | 7.16 | 14.9 | 0.0211 | 0.863 | 0.827 | 0.999 | 1.00 | 0.903 | |||
| CLM-Princeton | [-] | 265. | 273. | 265. | 262. | 8.26 | 15.7 | 0.0128 | 0.852 | 0.823 | 0.999 | 0.998 | 0.899 | |||
| ISBA-CTRIP-CRUJRA | [-] | 259. | 259. | 265. | 267. | -5.67 | 15.6 | 0.0208 | 0.879 | 0.808 | 0.999 | 0.998 | 0.898 | |||
| ISBA-CTRIP-GSWP3 | [-] | 266. | 267. | 265. | 267. | 1.94 | 13.1 | 0.0239 | 0.895 | 0.833 | 0.998 | 0.993 | 0.911 | |||
| ISBA-CTRIP-Princeton | [-] | 268. | 269. | 265. | 267. | 3.86 | 13.4 | 0.0185 | 0.887 | 0.833 | 0.999 | 0.981 | 0.907 | |||
| Mean-CRUJRA | [-] | 262. | 262. | 265. | 262. | -2.66 | 14.1 | 0.0228 | 0.908 | 0.814 | 0.998 | 1.00 | 0.907 | |||
| Mean-GSWP3 | [-] | 269. | 269. | 265. | 262. | 4.28 | 13.1 | 0.0217 | 0.892 | 0.835 | 0.999 | 0.997 | 0.912 | |||
| Mean-Princeton | [-] | 270. | 271. | 265. | 262. | 5.83 | 14.1 | 0.0184 | 0.877 | 0.831 | 0.999 | 0.990 | 0.905 |
Download Data |
Period Mean (original grids) [Watt m-2] |
Model Period Mean (intersection) [Watt m-2] |
Benchmark Period Mean (intersection) [Watt m-2] |
Model Period Mean (complement) [Watt m-2] |
Benchmark Period Mean (complement) [Watt m-2] |
Bias [Watt m-2] |
RMSE [Watt m-2] |
Phase Shift [months] |
Bias Score [1] |
RMSE Score [1] |
Seasonal Cycle Score [1] |
Spatial Distribution Score [1] |
Overall Score [1] |
|||
|---|---|---|---|---|---|---|---|---|---|---|---|---|---|---|---|---|
| Benchmark | [-] | 372. | ||||||||||||||
| CLM-CRUJRA | [-] | 372. | 372. | 372. | 399. | 0.261 | 14.4 | 0.370 | 0.852 | 0.790 | 0.973 | 1.00 | 0.881 | |||
| CLM-GSWP3 | [-] | 377. | 376. | 372. | 399. | 4.87 | 14.0 | 0.316 | 0.849 | 0.799 | 0.977 | 0.995 | 0.884 | |||
| CLM-Princeton | [-] | 376. | 376. | 372. | 399. | 4.39 | 14.3 | 0.305 | 0.843 | 0.799 | 0.978 | 0.998 | 0.883 | |||
| ISBA-CTRIP-CRUJRA | [-] | 362. | 362. | 372. | 399. | -9.84 | 16.4 | 0.178 | 0.795 | 0.800 | 0.986 | 1.00 | 0.876 | |||
| ISBA-CTRIP-GSWP3 | [-] | 367. | 367. | 372. | 399. | -4.72 | 14.1 | 0.200 | 0.844 | 0.799 | 0.985 | 0.995 | 0.885 | |||
| ISBA-CTRIP-Princeton | [-] | 368. | 368. | 372. | 399. | -4.02 | 14.3 | 0.166 | 0.838 | 0.801 | 0.987 | 0.998 | 0.885 | |||
| Mean-CRUJRA | [-] | 367. | 367. | 372. | 390. | -4.72 | 13.5 | 0.269 | 0.856 | 0.801 | 0.980 | 0.999 | 0.887 | |||
| Mean-GSWP3 | [-] | 372. | 372. | 372. | 390. | 0.119 | 12.2 | 0.251 | 0.889 | 0.805 | 0.982 | 0.993 | 0.895 | |||
| Mean-Princeton | [-] | 372. | 372. | 372. | 390. | 0.266 | 12.7 | 0.205 | 0.872 | 0.805 | 0.985 | 0.997 | 0.893 |
Temporally integrated period mean