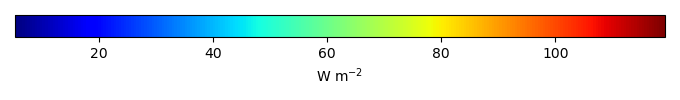
Mean State
Download Data |
Period Mean (original grids) [W m-2] |
Model Period Mean (intersection) [W m-2] |
Benchmark Period Mean (intersection) [W m-2] |
Model Period Mean (complement) [W m-2] |
Benchmark Period Mean (complement) [W m-2] |
Bias [W m-2] |
RMSE [W m-2] |
Phase Shift [months] |
Bias Score [1] |
RMSE Score [1] |
Seasonal Cycle Score [1] |
Spatial Distribution Score [1] |
Overall Score [1] |
|||
|---|---|---|---|---|---|---|---|---|---|---|---|---|---|---|---|---|
| Benchmark | [-] | 29.9 | ||||||||||||||
| CLM-CRUJRA | [-] | 30.0 | 30.2 | 30.1 | 18.3 | -0.0185 | 12.7 | 0.283 | 0.796 | 0.605 | 0.976 | 0.983 | 0.793 | |||
| CLM-GSWP3 | [-] | 28.0 | 28.1 | 30.1 | 18.3 | -2.10 | 12.3 | 0.340 | 0.790 | 0.607 | 0.968 | 0.974 | 0.789 | |||
| CLM-Princeton | [-] | 26.1 | 26.3 | 30.1 | 18.5 | -3.77 | 13.4 | 0.315 | 0.753 | 0.591 | 0.971 | 0.978 | 0.777 | |||
| ISBA-CTRIP-CRUJRA | [-] | 33.2 | 33.1 | 30.1 | 12.1 | 2.92 | 15.1 | 0.389 | 0.757 | 0.583 | 0.960 | 0.925 | 0.762 | |||
| ISBA-CTRIP-GSWP3 | [-] | 29.5 | 29.5 | 30.1 | 12.1 | -0.707 | 13.7 | 0.518 | 0.778 | 0.585 | 0.943 | 0.978 | 0.774 | |||
| ISBA-CTRIP-Princeton | [-] | 28.3 | 28.3 | 30.0 | 12.1 | -1.79 | 14.8 | 0.499 | 0.747 | 0.569 | 0.944 | 0.933 | 0.752 | |||
| JSBACH-CRUJRA | [-] | 26.0 | 25.5 | 30.3 | 25.0 | -0.824 | 17.5 | 0.966 | 0.742 | 0.492 | 0.892 | 0.918 | 0.707 | |||
| JSBACH-GSWP3 | [-] | 27.4 | 27.6 | 30.3 | 25.0 | -2.69 | 15.4 | 0.649 | 0.770 | 0.541 | 0.930 | 0.922 | 0.741 | |||
| JSBACH-Princeton | [-] | 22.1 | 22.0 | 30.3 | 25.0 | -4.94 | 17.5 | 1.13 | 0.738 | 0.499 | 0.854 | 0.973 | 0.713 | |||
| Mean-CRUJRA | [-] | 31.1 | 31.0 | 30.1 | 5.97 | 0.980 | 12.9 | 0.383 | 0.815 | 0.596 | 0.966 | 0.983 | 0.791 | |||
| Mean-GSWP3 | [-] | 28.6 | 28.5 | 30.1 | 5.97 | -1.59 | 12.0 | 0.399 | 0.827 | 0.608 | 0.964 | 0.967 | 0.795 | |||
| Mean-Princeton | [-] | 26.9 | 26.7 | 30.0 | 6.03 | -3.23 | 13.7 | 0.424 | 0.772 | 0.576 | 0.957 | 0.984 | 0.773 |
Download Data |
Period Mean (original grids) [W m-2] |
Model Period Mean (intersection) [W m-2] |
Benchmark Period Mean (intersection) [W m-2] |
Model Period Mean (complement) [W m-2] |
Benchmark Period Mean (complement) [W m-2] |
Bias [W m-2] |
RMSE [W m-2] |
Phase Shift [months] |
Bias Score [1] |
RMSE Score [1] |
Seasonal Cycle Score [1] |
Spatial Distribution Score [1] |
Overall Score [1] |
|||
|---|---|---|---|---|---|---|---|---|---|---|---|---|---|---|---|---|
| Benchmark | [-] | 36.7 | ||||||||||||||
| CLM-CRUJRA | [-] | 39.4 | 40.1 | 37.7 | 16.2 | 2.30 | 11.1 | 0.855 | 0.596 | 0.549 | 0.893 | 0.964 | 0.710 | |||
| CLM-GSWP3 | [-] | 37.8 | 38.7 | 37.7 | 16.2 | 0.888 | 10.5 | 0.881 | 0.647 | 0.528 | 0.885 | 0.977 | 0.713 | |||
| CLM-Princeton | [-] | 38.0 | 38.2 | 37.8 | 16.3 | 0.368 | 11.0 | 0.894 | 0.628 | 0.529 | 0.881 | 0.983 | 0.710 | |||
| ISBA-CTRIP-CRUJRA | [-] | 40.6 | 40.7 | 37.1 | 15.1 | 3.56 | 12.7 | 0.885 | 0.541 | 0.539 | 0.884 | 0.931 | 0.687 | |||
| ISBA-CTRIP-GSWP3 | [-] | 38.6 | 38.6 | 37.1 | 15.1 | 1.52 | 11.7 | 0.825 | 0.594 | 0.535 | 0.892 | 0.949 | 0.701 | |||
| ISBA-CTRIP-Princeton | [-] | 38.1 | 38.1 | 37.1 | 15.2 | 0.950 | 12.1 | 0.822 | 0.589 | 0.538 | 0.890 | 0.971 | 0.705 | |||
| JSBACH-CRUJRA | [-] | 45.0 | 45.0 | 39.4 | 20.7 | 2.22 | 12.9 | 1.06 | 0.578 | 0.533 | 0.862 | 0.972 | 0.696 | |||
| JSBACH-GSWP3 | [-] | 40.2 | 40.3 | 39.4 | 20.7 | 0.856 | 11.5 | 0.899 | 0.609 | 0.537 | 0.881 | 0.981 | 0.709 | |||
| JSBACH-Princeton | [-] | 43.2 | 43.2 | 39.4 | 20.7 | 0.0513 | 12.3 | 1.02 | 0.612 | 0.519 | 0.859 | 0.980 | 0.698 | |||
| Mean-CRUJRA | [-] | 40.4 | 40.4 | 36.8 | 24.5 | 3.56 | 11.3 | 0.827 | 0.573 | 0.563 | 0.898 | 0.944 | 0.708 | |||
| Mean-GSWP3 | [-] | 38.8 | 38.8 | 36.8 | 24.5 | 1.95 | 10.5 | 0.761 | 0.621 | 0.550 | 0.903 | 0.962 | 0.717 | |||
| Mean-Princeton | [-] | 38.1 | 38.1 | 36.8 | 24.6 | 1.27 | 11.2 | 0.808 | 0.614 | 0.543 | 0.893 | 0.979 | 0.714 |
Download Data |
Period Mean (original grids) [W m-2] |
Model Period Mean (intersection) [W m-2] |
Benchmark Period Mean (intersection) [W m-2] |
Model Period Mean (complement) [W m-2] |
Benchmark Period Mean (complement) [W m-2] |
Bias [W m-2] |
RMSE [W m-2] |
Phase Shift [months] |
Bias Score [1] |
RMSE Score [1] |
Seasonal Cycle Score [1] |
Spatial Distribution Score [1] |
Overall Score [1] |
|||
|---|---|---|---|---|---|---|---|---|---|---|---|---|---|---|---|---|
| Benchmark | [-] | 62.6 | ||||||||||||||
| CLM-CRUJRA | [-] | 64.5 | 64.7 | 63.2 | 16.8 | 1.36 | 10.3 | 0.618 | 0.603 | 0.606 | 0.942 | 0.992 | 0.750 | |||
| CLM-GSWP3 | [-] | 63.9 | 64.0 | 63.2 | 16.8 | 0.733 | 10.2 | 0.602 | 0.624 | 0.585 | 0.938 | 0.992 | 0.745 | |||
| CLM-Princeton | [-] | 63.7 | 63.9 | 63.4 | 16.8 | 0.397 | 10.2 | 0.605 | 0.602 | 0.597 | 0.936 | 0.991 | 0.745 | |||
| ISBA-CTRIP-CRUJRA | [-] | 61.9 | 62.1 | 62.7 | 16.9 | -0.543 | 12.9 | 0.601 | 0.508 | 0.625 | 0.941 | 0.932 | 0.726 | |||
| ISBA-CTRIP-GSWP3 | [-] | 60.7 | 60.9 | 62.7 | 16.9 | -1.70 | 12.7 | 0.536 | 0.520 | 0.625 | 0.948 | 0.934 | 0.730 | |||
| ISBA-CTRIP-Princeton | [-] | 60.6 | 60.8 | 62.8 | 17.0 | -1.92 | 13.0 | 0.465 | 0.509 | 0.631 | 0.954 | 0.930 | 0.731 | |||
| JSBACH-CRUJRA | [-] | 75.2 | 75.5 | 64.9 | 30.5 | 4.65 | 10.2 | 0.613 | 0.580 | 0.651 | 0.942 | 0.989 | 0.762 | |||
| JSBACH-GSWP3 | [-] | 67.8 | 67.8 | 64.9 | 30.5 | 2.92 | 9.57 | 0.524 | 0.609 | 0.635 | 0.950 | 0.988 | 0.764 | |||
| JSBACH-Princeton | [-] | 74.5 | 74.8 | 64.9 | 30.5 | 3.24 | 9.78 | 0.468 | 0.599 | 0.636 | 0.953 | 0.989 | 0.763 | |||
| Mean-CRUJRA | [-] | 65.0 | 64.9 | 62.5 | 61.4 | 2.45 | 9.51 | 0.586 | 0.611 | 0.650 | 0.947 | 0.972 | 0.766 | |||
| Mean-GSWP3 | [-] | 63.8 | 63.8 | 62.5 | 61.4 | 1.31 | 9.22 | 0.538 | 0.635 | 0.635 | 0.947 | 0.971 | 0.765 | |||
| Mean-Princeton | [-] | 63.8 | 63.7 | 62.6 | 61.5 | 1.16 | 9.46 | 0.497 | 0.619 | 0.641 | 0.950 | 0.968 | 0.764 |
Download Data |
Period Mean (original grids) [W m-2] |
Model Period Mean (intersection) [W m-2] |
Benchmark Period Mean (intersection) [W m-2] |
Model Period Mean (complement) [W m-2] |
Benchmark Period Mean (complement) [W m-2] |
Bias [W m-2] |
RMSE [W m-2] |
Phase Shift [months] |
Bias Score [1] |
RMSE Score [1] |
Seasonal Cycle Score [1] |
Spatial Distribution Score [1] |
Overall Score [1] |
|||
|---|---|---|---|---|---|---|---|---|---|---|---|---|---|---|---|---|
| Benchmark | [-] | 43.0 | ||||||||||||||
| CLM-CRUJRA | [-] | 43.2 | 43.2 | 43.1 | 13.7 | 0.0488 | 11.0 | 0.993 | 0.698 | 0.587 | 0.883 | 0.986 | 0.748 | |||
| CLM-GSWP3 | [-] | 41.8 | 41.6 | 43.1 | 13.7 | -1.52 | 9.23 | 0.696 | 0.728 | 0.629 | 0.918 | 0.972 | 0.775 | |||
| CLM-Princeton | [-] | 42.0 | 41.8 | 43.1 | 13.8 | -1.36 | 9.35 | 0.830 | 0.734 | 0.624 | 0.904 | 0.973 | 0.772 | |||
| ISBA-CTRIP-CRUJRA | [-] | 46.8 | 47.2 | 43.0 | 13.2 | 4.26 | 15.1 | 1.29 | 0.626 | 0.492 | 0.811 | 0.985 | 0.681 | |||
| ISBA-CTRIP-GSWP3 | [-] | 43.5 | 43.8 | 43.0 | 13.2 | 0.789 | 13.3 | 1.22 | 0.679 | 0.511 | 0.814 | 0.947 | 0.693 | |||
| ISBA-CTRIP-Princeton | [-] | 43.0 | 43.3 | 43.0 | 13.2 | 0.302 | 12.0 | 1.01 | 0.672 | 0.562 | 0.860 | 0.967 | 0.725 | |||
| JSBACH-CRUJRA | [-] | 37.3 | 34.5 | 43.5 | 28.8 | 0.569 | 10.2 | 1.08 | 0.703 | 0.614 | 0.862 | 0.990 | 0.756 | |||
| JSBACH-GSWP3 | [-] | 42.3 | 41.8 | 43.5 | 28.8 | -1.64 | 8.49 | 0.733 | 0.738 | 0.662 | 0.900 | 0.994 | 0.791 | |||
| JSBACH-Princeton | [-] | 37.1 | 33.6 | 43.5 | 28.8 | -0.532 | 9.27 | 0.854 | 0.724 | 0.635 | 0.888 | 0.988 | 0.774 | |||
| Mean-CRUJRA | [-] | 44.6 | 44.7 | 43.0 | 37.1 | 1.70 | 9.28 | 0.855 | 0.719 | 0.631 | 0.905 | 0.962 | 0.770 | |||
| Mean-GSWP3 | [-] | 42.3 | 42.3 | 43.0 | 37.1 | -0.724 | 8.15 | 0.611 | 0.763 | 0.655 | 0.926 | 0.903 | 0.780 | |||
| Mean-Princeton | [-] | 42.4 | 42.5 | 43.0 | 37.4 | -0.523 | 8.02 | 0.626 | 0.759 | 0.665 | 0.932 | 0.937 | 0.791 |
Download Data |
Period Mean (original grids) [W m-2] |
Model Period Mean (intersection) [W m-2] |
Benchmark Period Mean (intersection) [W m-2] |
Model Period Mean (complement) [W m-2] |
Benchmark Period Mean (complement) [W m-2] |
Bias [W m-2] |
RMSE [W m-2] |
Phase Shift [months] |
Bias Score [1] |
RMSE Score [1] |
Seasonal Cycle Score [1] |
Spatial Distribution Score [1] |
Overall Score [1] |
|||
|---|---|---|---|---|---|---|---|---|---|---|---|---|---|---|---|---|
| Benchmark | [-] | 18.0 | ||||||||||||||
| CLM-CRUJRA | [-] | 25.7 | 24.5 | 19.5 | 8.48 | 5.10 | 9.56 | 1.45 | 0.428 | 0.466 | 0.793 | 0.968 | 0.624 | |||
| CLM-GSWP3 | [-] | 22.9 | 21.8 | 19.5 | 8.48 | 2.30 | 8.22 | 1.39 | 0.521 | 0.470 | 0.808 | 0.967 | 0.647 | |||
| CLM-Princeton | [-] | 22.6 | 21.6 | 19.6 | 8.50 | 2.10 | 8.14 | 1.30 | 0.538 | 0.480 | 0.817 | 0.967 | 0.656 | |||
| ISBA-CTRIP-CRUJRA | [-] | 25.8 | 26.0 | 18.1 | 7.09 | 7.74 | 11.8 | 1.26 | 0.331 | 0.392 | 0.827 | 0.958 | 0.580 | |||
| ISBA-CTRIP-GSWP3 | [-] | 23.5 | 23.5 | 18.1 | 7.09 | 5.24 | 9.85 | 1.19 | 0.438 | 0.406 | 0.837 | 0.958 | 0.609 | |||
| ISBA-CTRIP-Princeton | [-] | 22.0 | 22.4 | 18.1 | 7.09 | 4.14 | 9.00 | 1.12 | 0.470 | 0.427 | 0.855 | 0.954 | 0.626 | |||
| JSBACH-CRUJRA | [-] | 30.3 | 31.5 | 21.5 | 11.0 | 6.52 | 12.9 | 1.53 | 0.314 | 0.392 | 0.790 | 0.931 | 0.564 | |||
| JSBACH-GSWP3 | [-] | 24.9 | 24.7 | 21.5 | 11.0 | 3.19 | 10.6 | 1.62 | 0.418 | 0.414 | 0.770 | 0.923 | 0.588 | |||
| JSBACH-Princeton | [-] | 24.9 | 26.3 | 21.5 | 11.0 | 2.29 | 10.4 | 1.68 | 0.448 | 0.415 | 0.764 | 0.925 | 0.594 | |||
| Mean-CRUJRA | [-] | 25.4 | 25.3 | 18.1 | 7.15 | 7.15 | 10.5 | 1.20 | 0.336 | 0.432 | 0.836 | 0.944 | 0.596 | |||
| Mean-GSWP3 | [-] | 22.4 | 22.5 | 18.1 | 7.15 | 4.36 | 8.49 | 0.987 | 0.448 | 0.450 | 0.870 | 0.932 | 0.630 | |||
| Mean-Princeton | [-] | 21.8 | 21.8 | 18.2 | 7.16 | 3.58 | 8.17 | 1.25 | 0.483 | 0.459 | 0.829 | 0.907 | 0.628 |
Download Data |
Period Mean (original grids) [W m-2] |
Model Period Mean (intersection) [W m-2] |
Benchmark Period Mean (intersection) [W m-2] |
Model Period Mean (complement) [W m-2] |
Benchmark Period Mean (complement) [W m-2] |
Bias [W m-2] |
RMSE [W m-2] |
Phase Shift [months] |
Bias Score [1] |
RMSE Score [1] |
Seasonal Cycle Score [1] |
Spatial Distribution Score [1] |
Overall Score [1] |
|||
|---|---|---|---|---|---|---|---|---|---|---|---|---|---|---|---|---|
| Benchmark | [-] | 22.7 | ||||||||||||||
| CLM-CRUJRA | [-] | 27.4 | 27.4 | 23.2 | 9.30 | 4.13 | 8.76 | 0.800 | 0.622 | 0.573 | 0.893 | 0.962 | 0.725 | |||
| CLM-GSWP3 | [-] | 24.5 | 24.5 | 23.2 | 9.30 | 1.27 | 7.65 | 0.860 | 0.720 | 0.570 | 0.882 | 0.950 | 0.738 | |||
| CLM-Princeton | [-] | 24.2 | 24.2 | 23.1 | 9.30 | 1.02 | 7.35 | 0.802 | 0.708 | 0.590 | 0.890 | 0.949 | 0.745 | |||
| ISBA-CTRIP-CRUJRA | [-] | 27.7 | 28.0 | 22.9 | 7.99 | 5.17 | 9.57 | 0.948 | 0.594 | 0.558 | 0.864 | 0.982 | 0.711 | |||
| ISBA-CTRIP-GSWP3 | [-] | 24.5 | 24.7 | 22.9 | 7.99 | 1.87 | 7.84 | 0.912 | 0.699 | 0.575 | 0.870 | 0.971 | 0.738 | |||
| ISBA-CTRIP-Princeton | [-] | 24.2 | 24.5 | 22.8 | 7.98 | 1.71 | 7.82 | 0.941 | 0.688 | 0.580 | 0.863 | 0.972 | 0.737 | |||
| JSBACH-CRUJRA | [-] | 27.0 | 27.1 | 24.2 | 13.1 | 3.07 | 11.1 | 1.39 | 0.612 | 0.506 | 0.785 | 0.728 | 0.628 | |||
| JSBACH-GSWP3 | [-] | 24.6 | 24.7 | 24.2 | 13.1 | 0.546 | 9.02 | 1.10 | 0.688 | 0.548 | 0.834 | 0.842 | 0.692 | |||
| JSBACH-Princeton | [-] | 21.7 | 21.9 | 24.2 | 13.1 | -0.442 | 9.51 | 1.34 | 0.680 | 0.533 | 0.786 | 0.844 | 0.675 | |||
| Mean-CRUJRA | [-] | 27.5 | 27.5 | 22.9 | 11.4 | 4.56 | 8.56 | 0.800 | 0.611 | 0.593 | 0.890 | 0.888 | 0.715 | |||
| Mean-GSWP3 | [-] | 24.5 | 24.5 | 22.9 | 11.4 | 1.61 | 7.07 | 0.678 | 0.716 | 0.604 | 0.909 | 0.888 | 0.744 | |||
| Mean-Princeton | [-] | 24.0 | 24.0 | 22.8 | 11.4 | 1.19 | 7.14 | 0.799 | 0.704 | 0.606 | 0.886 | 0.887 | 0.738 |
Download Data |
Period Mean (original grids) [W m-2] |
Model Period Mean (intersection) [W m-2] |
Benchmark Period Mean (intersection) [W m-2] |
Model Period Mean (complement) [W m-2] |
Benchmark Period Mean (complement) [W m-2] |
Bias [W m-2] |
RMSE [W m-2] |
Phase Shift [months] |
Bias Score [1] |
RMSE Score [1] |
Seasonal Cycle Score [1] |
Spatial Distribution Score [1] |
Overall Score [1] |
|||
|---|---|---|---|---|---|---|---|---|---|---|---|---|---|---|---|---|
| Benchmark | [-] | 22.6 | ||||||||||||||
| CLM-CRUJRA | [-] | 29.0 | 28.8 | 23.4 | 12.6 | 5.46 | 6.60 | 1.81 | 0.301 | 0.409 | 0.720 | 0.433 | 0.454 | |||
| CLM-GSWP3 | [-] | 26.6 | 26.5 | 23.4 | 12.6 | 3.12 | 5.39 | 1.70 | 0.496 | 0.365 | 0.744 | 0.413 | 0.476 | |||
| CLM-Princeton | [-] | 26.5 | 26.3 | 23.5 | 12.6 | 2.85 | 5.28 | 1.85 | 0.510 | 0.371 | 0.722 | 0.483 | 0.491 | |||
| ISBA-CTRIP-CRUJRA | [-] | 29.8 | 30.0 | 22.7 | 12.0 | 7.25 | 8.18 | 1.96 | 0.234 | 0.399 | 0.693 | 0.819 | 0.509 | |||
| ISBA-CTRIP-GSWP3 | [-] | 27.7 | 27.8 | 22.7 | 12.0 | 5.04 | 6.75 | 1.63 | 0.400 | 0.355 | 0.752 | 0.669 | 0.507 | |||
| ISBA-CTRIP-Princeton | [-] | 26.6 | 26.8 | 22.8 | 12.0 | 4.00 | 6.14 | 1.81 | 0.471 | 0.371 | 0.722 | 0.693 | 0.526 | |||
| JSBACH-CRUJRA | [-] | 28.6 | 28.6 | 24.4 | 17.0 | 5.42 | 6.66 | 1.83 | 0.356 | 0.388 | 0.726 | 0.939 | 0.559 | |||
| JSBACH-GSWP3 | [-] | 28.1 | 27.8 | 24.4 | 17.0 | 3.42 | 5.45 | 1.70 | 0.502 | 0.352 | 0.748 | 0.988 | 0.588 | |||
| JSBACH-Princeton | [-] | 25.1 | 25.0 | 24.4 | 17.0 | 1.74 | 5.14 | 1.92 | 0.504 | 0.346 | 0.709 | 0.989 | 0.579 | |||
| Mean-CRUJRA | [-] | 29.7 | 29.7 | 22.7 | 11.4 | 6.93 | 7.88 | 1.92 | 0.262 | 0.408 | 0.700 | 0.779 | 0.511 | |||
| Mean-GSWP3 | [-] | 27.5 | 27.5 | 22.7 | 11.4 | 4.80 | 6.53 | 1.62 | 0.439 | 0.366 | 0.757 | 0.585 | 0.502 | |||
| Mean-Princeton | [-] | 26.6 | 26.6 | 22.8 | 11.3 | 3.80 | 6.07 | 1.79 | 0.491 | 0.374 | 0.727 | 0.624 | 0.518 |
Download Data |
Period Mean (original grids) [W m-2] |
Model Period Mean (intersection) [W m-2] |
Benchmark Period Mean (intersection) [W m-2] |
Model Period Mean (complement) [W m-2] |
Benchmark Period Mean (complement) [W m-2] |
Bias [W m-2] |
RMSE [W m-2] |
Phase Shift [months] |
Bias Score [1] |
RMSE Score [1] |
Seasonal Cycle Score [1] |
Spatial Distribution Score [1] |
Overall Score [1] |
|||
|---|---|---|---|---|---|---|---|---|---|---|---|---|---|---|---|---|
| Benchmark | [-] | 26.8 | ||||||||||||||
| CLM-CRUJRA | [-] | 31.7 | 31.7 | 27.5 | 13.2 | 4.07 | 7.05 | 1.41 | 0.449 | 0.439 | 0.807 | 0.811 | 0.589 | |||
| CLM-GSWP3 | [-] | 30.7 | 30.7 | 27.5 | 13.2 | 3.12 | 6.86 | 1.55 | 0.535 | 0.377 | 0.777 | 0.903 | 0.594 | |||
| CLM-Princeton | [-] | 31.0 | 31.0 | 27.6 | 13.2 | 3.41 | 6.88 | 1.61 | 0.520 | 0.380 | 0.762 | 0.881 | 0.585 | |||
| ISBA-CTRIP-CRUJRA | [-] | 32.0 | 32.1 | 27.1 | 12.6 | 5.01 | 7.55 | 1.37 | 0.408 | 0.464 | 0.812 | 0.760 | 0.582 | |||
| ISBA-CTRIP-GSWP3 | [-] | 31.1 | 31.2 | 27.1 | 12.6 | 4.12 | 6.86 | 1.23 | 0.479 | 0.442 | 0.828 | 0.833 | 0.605 | |||
| ISBA-CTRIP-Princeton | [-] | 30.8 | 30.9 | 27.1 | 12.6 | 3.82 | 6.62 | 1.32 | 0.500 | 0.447 | 0.810 | 0.830 | 0.607 | |||
| JSBACH-CRUJRA | [-] | 33.1 | 33.2 | 28.5 | 17.7 | 6.55 | 8.51 | 1.44 | 0.369 | 0.447 | 0.803 | 0.980 | 0.609 | |||
| JSBACH-GSWP3 | [-] | 34.4 | 34.4 | 28.5 | 17.7 | 5.91 | 8.01 | 1.41 | 0.396 | 0.401 | 0.801 | 0.984 | 0.597 | |||
| JSBACH-Princeton | [-] | 31.9 | 31.9 | 28.5 | 17.7 | 4.54 | 7.52 | 1.53 | 0.461 | 0.383 | 0.775 | 0.981 | 0.597 | |||
| Mean-CRUJRA | [-] | 32.8 | 32.8 | 27.1 | 14.1 | 5.76 | 7.71 | 1.35 | 0.389 | 0.470 | 0.816 | 0.809 | 0.591 | |||
| Mean-GSWP3 | [-] | 32.0 | 32.0 | 27.1 | 14.1 | 4.96 | 7.23 | 1.31 | 0.457 | 0.420 | 0.815 | 0.868 | 0.596 | |||
| Mean-Princeton | [-] | 31.5 | 31.6 | 27.1 | 14.1 | 4.48 | 7.00 | 1.42 | 0.485 | 0.418 | 0.792 | 0.856 | 0.594 |
Download Data |
Period Mean (original grids) [W m-2] |
Model Period Mean (intersection) [W m-2] |
Benchmark Period Mean (intersection) [W m-2] |
Model Period Mean (complement) [W m-2] |
Benchmark Period Mean (complement) [W m-2] |
Bias [W m-2] |
RMSE [W m-2] |
Phase Shift [months] |
Bias Score [1] |
RMSE Score [1] |
Seasonal Cycle Score [1] |
Spatial Distribution Score [1] |
Overall Score [1] |
|||
|---|---|---|---|---|---|---|---|---|---|---|---|---|---|---|---|---|
| Benchmark | [-] | 48.7 | ||||||||||||||
| CLM-CRUJRA | [-] | 33.7 | 42.4 | 48.5 | 49.6 | -6.16 | 21.3 | 0.211 | 0.848 | 0.695 | 0.986 | 0.936 | 0.832 | |||
| CLM-GSWP3 | [-] | 29.3 | 42.3 | 48.5 | 49.6 | -6.19 | 20.4 | 0.244 | 0.852 | 0.687 | 0.983 | 0.983 | 0.838 | |||
| CLM-Princeton | [-] | 37.0 | 39.4 | 48.7 | 49.8 | -9.35 | 24.3 | 0.227 | 0.793 | 0.658 | 0.983 | 0.946 | 0.808 | |||
| ISBA-CTRIP-CRUJRA | [-] | 44.8 | 44.5 | 48.6 | 46.7 | -4.23 | 20.4 | 0.187 | 0.860 | 0.706 | 0.987 | 0.900 | 0.832 | |||
| ISBA-CTRIP-GSWP3 | [-] | 43.2 | 42.9 | 48.6 | 46.7 | -5.77 | 20.0 | 0.200 | 0.858 | 0.693 | 0.985 | 0.981 | 0.842 | |||
| ISBA-CTRIP-Princeton | [-] | 41.5 | 41.3 | 48.7 | 47.0 | -7.49 | 23.8 | 0.210 | 0.818 | 0.662 | 0.985 | 0.957 | 0.817 | |||
| JSBACH-CRUJRA | [-] | 43.0 | 42.8 | 48.3 | 51.2 | -9.51 | 28.2 | 0.395 | 0.807 | 0.593 | 0.971 | 0.956 | 0.784 | |||
| JSBACH-GSWP3 | [-] | 37.6 | 38.9 | 48.3 | 51.2 | -9.43 | 24.4 | 0.287 | 0.817 | 0.628 | 0.980 | 0.990 | 0.808 | |||
| JSBACH-Princeton | [-] | 38.7 | 38.5 | 48.3 | 51.2 | -10.5 | 28.9 | 0.465 | 0.764 | 0.585 | 0.958 | 0.927 | 0.764 | |||
| Mean-CRUJRA | [-] | 42.3 | 42.2 | 48.6 | 47.4 | -6.44 | 21.7 | 0.200 | 0.854 | 0.685 | 0.987 | 0.929 | 0.828 | |||
| Mean-GSWP3 | [-] | 41.6 | 41.5 | 48.6 | 47.4 | -7.12 | 20.4 | 0.225 | 0.856 | 0.688 | 0.984 | 0.984 | 0.840 | |||
| Mean-Princeton | [-] | 39.4 | 39.4 | 48.7 | 47.7 | -9.31 | 24.9 | 0.235 | 0.796 | 0.645 | 0.984 | 0.950 | 0.804 |
Download Data |
Period Mean (original grids) [W m-2] |
Model Period Mean (intersection) [W m-2] |
Benchmark Period Mean (intersection) [W m-2] |
Model Period Mean (complement) [W m-2] |
Benchmark Period Mean (complement) [W m-2] |
Bias [W m-2] |
RMSE [W m-2] |
Phase Shift [months] |
Bias Score [1] |
RMSE Score [1] |
Seasonal Cycle Score [1] |
Spatial Distribution Score [1] |
Overall Score [1] |
|||
|---|---|---|---|---|---|---|---|---|---|---|---|---|---|---|---|---|
| Benchmark | [-] | 31.7 | ||||||||||||||
| CLM-CRUJRA | [-] | 35.3 | 35.3 | 32.1 | 11.4 | 3.27 | 10.2 | 0.874 | 0.653 | 0.569 | 0.889 | 0.955 | 0.727 | |||
| CLM-GSWP3 | [-] | 32.3 | 32.3 | 32.1 | 11.4 | 0.243 | 9.06 | 0.911 | 0.718 | 0.571 | 0.880 | 0.895 | 0.727 | |||
| CLM-Princeton | [-] | 32.7 | 32.8 | 32.1 | 11.4 | 0.693 | 9.30 | 0.881 | 0.715 | 0.571 | 0.882 | 0.943 | 0.736 | |||
| ISBA-CTRIP-CRUJRA | [-] | 37.5 | 37.3 | 31.8 | 9.82 | 5.55 | 11.7 | 0.822 | 0.602 | 0.537 | 0.888 | 0.986 | 0.710 | |||
| ISBA-CTRIP-GSWP3 | [-] | 33.9 | 33.7 | 31.8 | 9.82 | 1.95 | 9.83 | 0.805 | 0.697 | 0.555 | 0.890 | 0.975 | 0.734 | |||
| ISBA-CTRIP-Princeton | [-] | 33.7 | 33.5 | 31.8 | 9.83 | 1.70 | 9.69 | 0.759 | 0.691 | 0.566 | 0.897 | 0.981 | 0.740 | |||
| JSBACH-CRUJRA | [-] | 31.9 | 32.7 | 33.1 | 15.6 | -0.499 | 11.8 | 1.33 | 0.660 | 0.524 | 0.808 | 0.932 | 0.690 | |||
| JSBACH-GSWP3 | [-] | 30.9 | 31.1 | 33.1 | 15.6 | -1.95 | 10.8 | 1.07 | 0.661 | 0.554 | 0.846 | 0.930 | 0.709 | |||
| JSBACH-Princeton | [-] | 30.1 | 31.3 | 33.1 | 15.6 | -2.58 | 11.2 | 1.06 | 0.660 | 0.542 | 0.845 | 0.952 | 0.708 | |||
| Mean-CRUJRA | [-] | 34.8 | 34.9 | 31.8 | 18.8 | 3.09 | 9.14 | 0.741 | 0.663 | 0.606 | 0.908 | 0.931 | 0.743 | |||
| Mean-GSWP3 | [-] | 32.1 | 32.2 | 31.8 | 18.8 | 0.394 | 8.29 | 0.663 | 0.714 | 0.609 | 0.912 | 0.878 | 0.744 | |||
| Mean-Princeton | [-] | 31.8 | 32.0 | 31.8 | 18.8 | 0.226 | 8.57 | 0.693 | 0.713 | 0.604 | 0.906 | 0.912 | 0.748 |
Temporally integrated period mean